Math Graphing Activities Interpreting Graphs and Data Worksheets Line Pie Bar
- PDF
- Easel Activity
What educators are saying
Also included in
- This is a GIANT bundle containing a huge selection of resources aligned to 3rd grade standards! There are 100 full-length math and ELA products including centers, games, assessments, worksheets and more.These were all classroom tested with my own third grade students. You will love how much time andPrice $205.00Original Price $309.85Save $104.85
- This bundle contains 12 math resources for 4th grade including worksheets, task cards, games, and activities for centers. These resources cover a variety of grade 4 math skills:converting place valuesfactorsdivision with remaindersclassifying polygonsproperties of shapesunits of measurementgraphs anPrice $24.99Original Price $35.70Save $10.71
Description
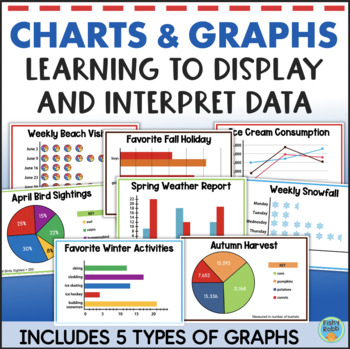
Representing and interpreting data using graphs and charts is the focus of this math resource for upper elementary grades. It helps students explore and understand data analysis.
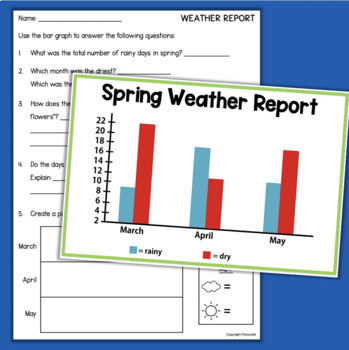
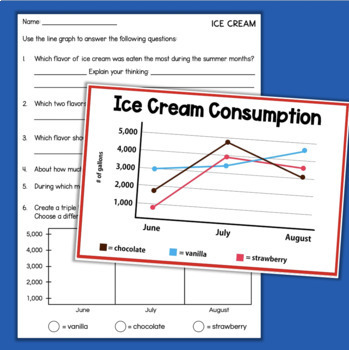
For each activity, students will use a graph to answer questions about the data.
They will also create another type of graph, chart, or table based on the information provided. This added step really helps students understand the various types of graphs and ways in which data can be displayed.
These activities are perfect for both guided practice in your math groups or independent practice during math centers.
The activities in this resource involve the following types of graphs:
- pictographs
- bar graphs
- double bar graphs
- pie charts
- line graphs
All of the graphs have a seasonal theme such as weekly snowfall amounts, number of beach visitors, or spring bird sightings.
Includes:
- 8 colorful graphs (2 for each season) in both full- and half-page sizes
- 8 activity pages/worksheets for interpreting the data and making new graphs based on data
- Answer keys
- Digital activities
✅ Check out the PREVIEW to see what's included!
DIGITAL ACTIVITIES
This graphing resource includes digital math activities that can be used with TpT's Easel feature. They can be assigned in your online learning platform (LMS) for students to complete on any device.
STANDARDS SUPPORTED BY THIS RESOURCE
3.MD.B.3
Draw a scaled picture graph and a scaled bar graph to represent a data set with several categories. Solve one- and two-step “how many more” and “how many less” problems using information presented in scaled bar graphs. For example, draw a bar graph in which each square in the bar graph might represent 5 pets.
4.MD.B.4
Make a line plot to display a data set of measurements in fractions of a unit (1/2, 1/4, 1/8). Solve problems involving addition and subtraction of fractions by using information presented in line plots. For example, from a line plot find and interpret the difference in length between the longest and shortest specimens in an insect collection.
RI.4.7
Interpret information presented visually, orally, or quantitatively (e.g., in charts, graphs, diagrams, time lines, animations, or interactive elements on Web pages) and explain how the information contributes to an understanding of the text in which it appears.
❤️ Get this resource and more in your own Custom Bundle
✅ Don't forget to follow me to be notified about my weekly deals and when new products are added!


