TPT
Total:
$0.00

Probability Carnival Game Project - PDF & Digital

Rated 4.78 out of 5, based on 116 reviews
4.8 (116 ratings)
;
Laney Lee
3k Followers
Grade Levels
6th - 8th
Resource Type
Standards
Formats Included
  • PDF
  • Google Apps™
Pages
17 pages
$5.00
$5.00
Share this resource
Report this resource to TPT
Laney Lee
3k Followers
Includes Google Apps™
The Teacher-Author indicated this resource includes assets from Google Workspace (e.g. docs, slides, etc.).
Easel Activity Included
This resource includes a ready-to-use interactive activity students can complete on any device.  Easel by TPT is free to use! Learn more.

What educators are saying

Great project for end of the year when students and teachers are burnt out from the same routine of learning.
My students loved this. I used the resources when creating our Probability Carnival and was very engaging. Thank you

Description

Looking for a fun, hands on way to bring probability to life? Are you ready to move past the "sit and get" style of whole group instruction? If you answered yes to either of those questions, then this resource is for you!

Keep your students engaged and accountable with the interactive, versatile Probability Carnival! The steps of this project are designed to be rigorous and require students to predict, reflect, connect, and think critically about the situations being investigated.

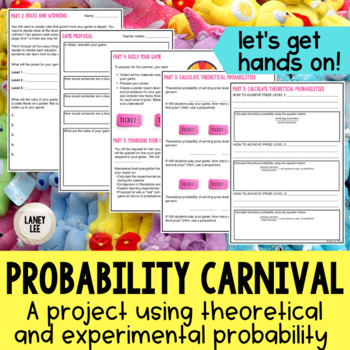
Using this project, student will design and run a carnival game with compound events leading up to 3 levels of prizes. Students must submit a game proposal and get approved by their teacher, calculate the theoretical probability of winning each prize, and then collect data and determine experimental probability. Reflection questions are included at the end.

What's Included?

  • Teacher Tips
  • 10 page Student Packet
  • Sample Project
  • Rubric
  • Student Progress Tracker

Purchase secures a printable PDF file in color. On page 2 of this resource you will find a link to a student friendly Google Slide version of this file. You will be able to copy this file and use it with Google Classroom or any other paperless initiative.

Please take a look at the preview file to see more of this resource.

Who is this resource for?

This resource can be used by classroom teachers, tutors, and parents of students in grades 6-9. It provides a variety of practice covering the mentioned topics.

How Can I Use this Resource?

  • Use this resource to practice and reinforce skills in determining theoretical and experimental probability
  • The Probability Carnival makes a great summative project or end of the year hands on activity
  • Extension activity for early finishers or for students who show a special interest in the topic

This is an Easel Resource Too!

We know you're busy, so this resource has already been prepped for use in Easel by TPT. That means that in the Easel Activity, all non-student pages have been removed and answer boxes have been added where they're needed. You can assign this resource to your students as a fillable PDF just seconds after purchasing, with no extra steps on your end.

More questions?

Email me at laneyleeteaches@gmail.com.

-------------------------------------------------------------------------------------------------------------------------------

*****Check out this blog post to see more examples of student work!******

-------------------------------------------------------------------------------------------------------------------------------

To stay updated on sales and new products, please follow my store:

My TpT Store

Connect and chat with me!

My Blog

Newsletter

My Facebook Page

On Pinterest

Instagram

Total Pages
17 pages
Answer Key
Included with rubric
Teaching Duration
1 Week
Report this resource to TPT
Reported resources will be reviewed by our team. Report this resource to let us know if this resource violates TPT’s content guidelines.

Standards

to see state-specific standards (only available in the US).
Understand that the probability of a chance event is a number between 0 and 1 that expresses the likelihood of the event occurring. Larger numbers indicate greater likelihood. A probability near 0 indicates an unlikely event, a probability around 1/2 indicates an event that is neither unlikely nor likely, and a probability near 1 indicates a likely event.
Approximate the probability of a chance event by collecting data on the chance process that produces it and observing its long-run relative frequency, and predict the approximate relative frequency given the probability. For example, when rolling a number cube 600 times, predict that a 3 or 6 would be rolled roughly 200 times, but probably not exactly 200 times.
Develop a probability model and use it to find probabilities of events. Compare probabilities from a model to observed frequencies; if the agreement is not good, explain possible sources of the discrepancy.
Develop a uniform probability model by assigning equal probability to all outcomes, and use the model to determine probabilities of events. For example, if a student is selected at random from a class, find the probability that Jane will be selected and the probability that a girl will be selected.
Develop a probability model (which may not be uniform) by observing frequencies in data generated from a chance process. For example, find the approximate probability that a spinning penny will land heads up or that a tossed paper cup will land open-end down. Do the outcomes for the spinning penny appear to be equally likely based on the observed frequencies?

Reviews

Questions & Answers

3k Followers