
Scatter Plot Trend Line of Best Fit Correlation Coefficient Practice Task Cards


- PDF
- Internet Activities
What educators are saying
Also included in
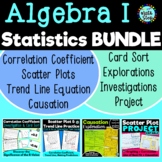 Grab this bundle for your Algebra 1 Statistics Linear Regression Unit that covers discovering the significance of the correlation coefficient/r-value, scatter plots and making predictions using the trend line/line of best fit, and causation. Then wrap up your unit with the included project. StudentsPrice $11.00Original Price $15.00Save $4.00
Description
Students are given five different scatter plot scenarios (for example, temperature and the number of ice creams sold) with a table and graph already created. Their job is to use a calculator to find the correlation coefficient and equation of the line of best fit. Then for each one, they are asked to:
➤ State the correlation coefficient/r-value.
➤ Describe the strength and direction of the scatter plot.
➤ Find the equation of the line of best fit/trend line.
➤ Draw the line of best fit on the scatter plot.
➤ Predict a certain value using the trend line equation.
The possibilities are not exclusive to the following, but do include:
1. A PRINT & GO OPTION that has all five scenarios and questions/prompts on a front and back page.
OR
2. A TASK CARD OPTION, where I like to have students put each scenario separately in a plastic sleeve and use a dry erase marker to answer the questions and create the line of best fit on the scatter plot graph. Once they have completed one scenario and gotten it checked, they trade it out for the next.
This resource includes five scenarios/task cards (the print & go option or the task card option), and an answer key.
This resource is a great precursor to my Scatter Plot Project. Check it out!
