
Statistics Anchor Charts Posters | Middle School Math Statistics


- PDF
What educators are saying
Also included in
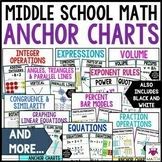 These middle school math anchor charts include a variety of topics: fraction operations, percent bar models, integer operations, expressions, exponent rules, angles, and congruence and similarity. These middle school math posters focus on making sense of the math and are perfect to use as anchor chaPrice $47.00Original Price $72.50Save $25.50
Description
These statistics anchor charts or personal reference sheets include visuals for dot plots, histograms, box plots, and scatter plots. They also include measures of center: mean, median, and mode, as well as measures of variation: interquartile range and mean absolute deviation. Colored and black and white copies are included.
Colored and black and white copies are included. Check out the preview to see all the anchor charts.
Includes:
- Dot Plot and Histogram
- Box Plot
- Measures of Center: Mean, Median, Mode
- Measures of Variation: Interquartile Range, Mean Absolute Deviation
- Scatter Plots
- How to create your own poster instructions
Other Products you may be Interested in
▸ Congruence and Similarity Anchor Charts
★ FOLLOW ME for more great products to make sense of math!
Remember that leaving feedback earns you points toward FREE TPT purchases!
Please feel free to contact me with any questions!
Michelle,
Make Sense of Math
michelle@makesenseofmath.com
