MD Special Educator
785 Followers
Grade Levels
1st - 6th
Subjects
Resource Type
Formats Included
- Publisher files
MD Special Educator
785 Followers
Description
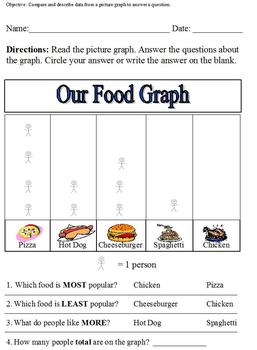
This is modified for sixth grade special ed, statistics. Students will read the graph and answer the questions. This can also be used in primary grades.
Total Pages
Answer Key
N/A
Teaching Duration
N/A
Report this resource to TPT
Reported resources will be reviewed by our team. Report this resource to let us know if this resource violates TPT’s content guidelines.


