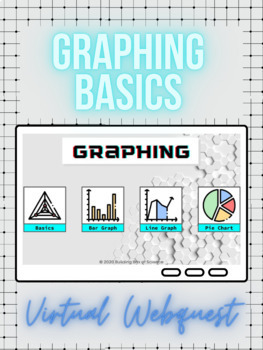
Graphing Basics Self-Guided Webquest
- Google Drive™ folder
- Internet Activities
- Webquests

Also included in
- This is a ❗CUSTOM❗ bundle created for a specific buyer. Please do not purchase this bundle unless you are the person this was created for as refunds and exchanges will NOT be issued through TPT.HOWEVER, if the products in this bundle are appropriate for your students and content, you are free to purPrice $29.50Original Price $42.00Save $12.50
- Get 30% off each webquest with the "Back to School" Science Lab Self-Guided Webquest Bundle! These three virtual webquests will set your students up for laboratory success with assignments on Lab Safety & Equipment, essential Science Skills, and Graphing. Students will learn:Lab Safety & EquPrice $8.50Original Price $12.00Save $3.50
Description
Introduce the Basics of Graphing with this Virtual Science WebQuest ideal for the beginning of the year! Students can answer the questions within their own copy of the presentation or they can complete the PDF Worksheet while viewing the Slides in Present Mode. This assignment is a great way to teach students how and when to use a bar graph, line graph, or pie chart. It can be taught face-to-face as review or assigned in Google Classroom as a sub lesson. This Interactive Assignment covers:
⚗️ Basics of Graphing (DRY MIX, Scale, etc...)
⚗️ Bar Graphs
⚗️ Line Graphs
⚗️ Pie Charts
⚗️ Review Questions
NOTE: This assignment requires the Internet and links to external resources. Please preview these before assigning to your students. If any of the links become broken or change, please send me an email to let me know. Check them out below!
NOTE: There are multiple drawing and fill in the blank slides in this activity - the interactives will only work if the Slides are NOT in present mode. Please make sure to select "Students get their own Copy" in Google Classroom for these to work correctly. I have added suggestions in the Speaker Notes to help students construct a graph in Google Slides.
Basics: Create Graphs in Science
Bar Graph: Creating a Bar Chart
Line Graph: How to Plot a Line Graph
Purchase includes a Google Drive Folder with a unique copy of the Google Slides Presentation (17 slides) and a PDF Student Worksheet (4 pages).
❗Permission is granted to copy pages specifically for student or teacher use only by the original purchaser or licensee. The reproduction of this product for any other use is strictly prohibited. Copying this product in any part and placing it on the Internet (even on a personal website) is strictly prohibited and a violation of the Digital Millennium Copyright Act (DCMA).
__________________________________________________________________
⭐ BE THE FIRST TO LEARN ABOUT NEW SCIENCE RESOURCES! ⭐
Hit the Green Star at the top of the page to follow my store! This will allow you to receive notifications whenever I update current resources and add brand new items.


