125 results
Graphing laboratory microsofts

Beaker Pong: Experimental Design and Graphing Lab, NGSS aligned
Great 1st week or 1st month STEM activity! All parts are EDITABLE and includes a graphing grid! This is a great way to introduce the "science process" (better phrase for scientific method) at the start of a semester or anytime you want fun to occur in your classroom.*****Focus on the NGSS PRACTICES Dimension*****The National Research Council's (NRC) Framework describes a vision of what it means to be proficient in science; it rests on a view of science as both a body of knowledge and an evidenc
Subjects:
Grades:
7th - 12th
Types:
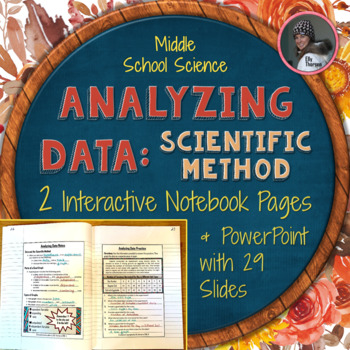
Analyzing Data Interactive Notebook Pages & PowerPoint for the Scientific Method
This middle school science resource has two interactive notebook pages and a 29 slide PowerPoint about analyzing data and making good graphs in the scientific method. The INB pages and PowerPoint emphasize these important graphing concepts:a title that's a combination of the independent and dependent variablesan x-axis label that contains the independent variablea y-axis label that contains the dependent variableaccurate intervals on graphsthe purposes and uses of bar graphs, line graphs, and pi
Subjects:
Grades:
5th - 8th
NGSS:
MS-ETS1-3
Also included in: Scientific Method Interactive Notebook Pages and PowerPoint BUNDLE
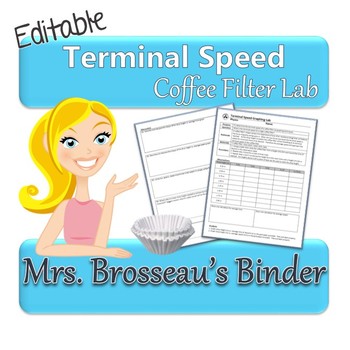
Terminal Speed Physics Lab & Graphing Activity using Coffee Filters {EDITABLE}
Do you want a teach your students about terminal speed, but can't find the time to put together a complex lab and then mark it all?
This is the lab for you!
This is part of my cost-saving, amazing Physics Bundle!
This is a quick lab that your students can complete start to finish in one class period. The student handout pages include:
• Purpose
• Question
• Rationale
• Materials
• Procedure
• Observation Table
• Graphing and Follow-up Questions + Conclusion
You'll need:
• meter stick
• coff
Grades:
7th - 12th
Types:
Flip Book Transformation Project
Students create a flip book using Power Point to discover and/or apply properties of geometric transformations. The student handout provides detailed instructions on how to create the flip book which includes using the “duplicate slide” feature in Power Point. Students are required* to create a minimum of 10 slides with 4 different movements. Students are given the opportunity to choose what type of movements they use within given parameters. This choice provides the opportunity for great di
Grades:
7th - 10th
Types:
Also included in: Transformations Bundle
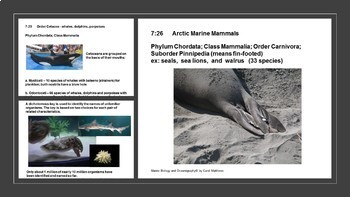
Polar Seas - Ocean/Marine Biology Unit 7
Polar Seas are unique habitats that influence climate and account for the diverse characteristics of polar animals such as Pinnipeds, Cetaceans and Penguins. They will use technology research skills, practice graphing from a computer program such as Excel, and to use photoperiods as a predictor to hemisphere location. Taxonomy is review by having students develop their own dichotomous key.Unit curriculum includes these bookmarked sections:IntroductionStudent SyllabusTeacher Pacing guideLesson Pl
Subjects:
Grades:
10th - 12th
Also included in: Marine Biology and Oceanography Full Year, 12 Unit Bundle
Next Generation Science Lab: How Gross is your Phone? A Bacteria Lab
NGSS Claim and Reasoning lab where students design and culture bacteria found on their phone. This is an open ended inquiry lab. Students are given a list of materials and asked to come up with their own procedures to support a claim.
This lab goes with a unit over Bacteria and Viruses. I use this lab as a replacement for the recipe lab of growing bacteria. Since students are designing a test, and using their own property, it makes the learning all that more relevant!
I use this lab i
Subjects:
Grades:
7th - 12th
Types:

Christmas Science Lab Dissolving Candy Cane Experiment
STEM Your students will be very interested in this activity. It has become a holiday tradition that my students look forward to experiencingStudents in this laboratory activity work cooperatively to produce the desired product, make observations, and examine the effect of heat on bonding forces. They complete a written handout relating to the effect of heat on bonding and have lots of fun.The product contains 2 labs. At the conclusion, students will answer questions and complete a graph. Detai
Grades:
7th - 10th
Types:
NGSS:
MS-PS1-4
Physics Lab Kinetic, Potential, Graphing, Measurement 6th 7th 8th Middle School
This hands on lab titled physics Olympics was created for middle school and early high school students and is the culmination of the physics unit I teach to my middle school students. Students travel to various stations to get actual hands-on practice of physics concepts, as well as measurement and graphing review. Students go through various Olympic “events” like a discus throw with a paper plate, etc. Concepts covered include kinetic energy, potential energy, getting mass using a triple beam b
Grades:
6th - 9th
Types:

bar graph pie graph graphing thermometer lab PowerPoint STEM 3 4 5 6 TX TEKS
This fun, hands-on, lab and graphing activity gets your students thinking deeply and putting their knowledge of graphing, gathering data, and following instructions to the test. Perfect for test prep! Great way to incorporate science, technology, engineering, and math (STEM) concepts into a fun lesson. This lesson was created for elementary and middle school students and is great practice to help students reinforce the concepts of graphing, data gathering, creating bar graphs, creating pie graph
Subjects:
Grades:
3rd - 6th

6th Grade Science Bellringer (Do Now) Semester 2
These slides are warmups or 'bellringers' for the second semester of 6th grade Science. They cover the following TEKS (objectives for Texas Science): 6.8b Unbalanced Forces, 6.8d Graphing Changes in Motion, 6.8e Inclined Planes and Pulleys Change Force Needed to Move an Object, 6.11b Gravity is the force that governs the motion of our solar system, 6.11a Describe the physical properties, locations, and movements of (objects in our solar system), 6.11c Space Exploration, 6.10a Earth Structures,
Subjects:
Grades:
6th
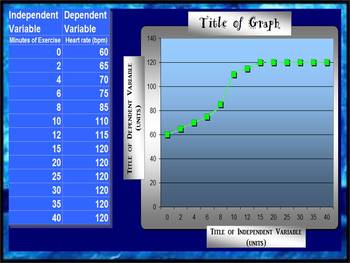
LINE GRAPH MAKER (AUTOMATIC)
This spreadsheet allows you to insert your independent and dependent variables into a chart and voila!... a line graph is generated as you enter in each piece of new data! Students love to take their data from a lab and watch as a graph is made right before their eyes! You can change all of the titles on the chart and the graph to suit your classes laboratory experiment needs! Students can easily print out their data to include in their lab reports!
Grades:
2nd - 12th
Types:
NGSS / NYSSLS Aligned Marble Roll Challenge Graphing Lab with Key / Lesson Plan
Looking for a time-saving, standards-aligned science hands-on resource to teach graphing? Explore our "Marble Roll Challenge Lab" – NGSS and NYSSLS-aligned lesson that includes a lesson plan and an answer key! Elevate your middle school science class with this engaging hands-on activity that requires the easiest supplies! Teach variables, data collection, and graphing effortlessly. Unlock success with this ready-to-use, time-saving resource today! Key Benefits:Time-Saving Lesson Plan: Our compr
Subjects:
Grades:
7th - 10th
Types:
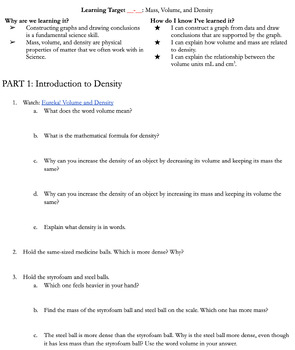
Mass, Volume, and Density Graphing Activities (Editable Doc)
There are so many ways to teach density it can be overwhelming to choose what to do. This is the best way I have found to teach it in my 10+ years of teaching Science. This lesson helps students learn so many things at the same time! It gives students:An introduction to the physical properties mass, volume, and densityAn introduction to water displacement to measure volumeAn opportunity to practice making measurementsAn opportunity to practice graphing data they collectAn opportunity to practice
Subjects:
Grades:
8th - 12th
Types:
Weather Tracking in Excel
Compatible with Google Sheets, Google Classroom, or as a stand-alone file on a PC, this product is a must have for any teacher comparing weather conditions in multiple locations!
BEFORE YOU BUY: This file is part of a larger unit. Save yourself money by purchasing the Super Science Set for Weather and Climate nstead of buying each file separately.
Purchased alone, you get:
⭐ An Excel workbook that enables students to track the weather for 5 different locations as a whole class or individ
Subjects:
Grades:
4th - 8th
Types:
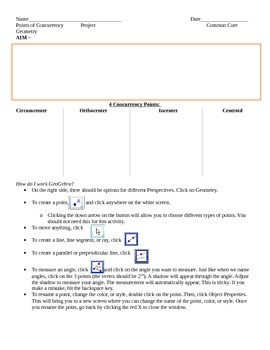
Common Core Geometry Points of Concurrency GeoGebra Project
This project is used in my Common Core Geometry class in Chapter 1 to introduce students to the online tool GeoGebra while investigating centroids, orthocenters, circumcenters, and incenters. Students construct each of the centers listed above and then investigate their properties in an acute, obtuse, and right triangle. This resource provides a brief introduction to the button controls on GeoGebra and shows students step by step which buttons (through pictures) to choose to construct the center
Subjects:
Grades:
9th - 11th
Types:
CCSS:
Olympic Proportions (Eight 7th Grade Math Stations)
This lesson connects 7th grade Common Core math standards in Ratio/Proportions and Geometry to the 2014 Winter Olympics in Sochi, Russia. Students will work in groups of 3 to 5 and rotate about every 15 minutes to each station. Students will apply their knowledge of ratio, rate, unit rate, constant of proportionality, tables, graphs, writing equations, and computing actual lengths from a map using scale. Stations include interesting facts about the winter Olympics in Russia and/or require stu
Subjects:
Grades:
6th - 8th
Types:
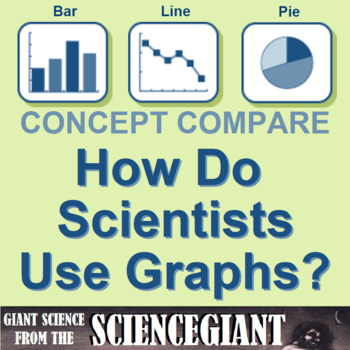
Concept Comparison: Graphs in Science (Categorical vs Numerical)
How do scientists use graphs? This concept comparison helps students contrast bar graphs, pie charts and line graphs created from categorical and numerical data. The recall device uses DRY MIX and TRAILS as acronyms to help Ss remember how variables are plotted on a graph, and standard format for a graph. The frame comparison helps students contrast rate of change, slope shape and written relationships of functions (y vs. x; y vs. x^2; y vs. 1/x, and so on). THREE (3) activities are included:ha
Subjects:
Grades:
6th - 12th
NGSS:
HS-ETS1-3
, MS-ETS1-3
Also included in: StayGiant Physics Bundle: Measurement
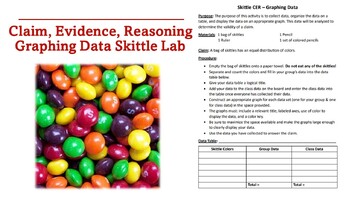
Claim, Evidence, Reasoning - Graphing Data Skittles Lab
This CER lab is a fun way to get students to collect, organize, and display data and then use that data as evidence to evaluate the validity of a claim. The file is editable so you may modify the assignment as needed to fit the needs of your students.
Subjects:
Grades:
7th - 12th
Types:
Environment The Effect of Salt on Brine Fish Hatching Inquiry Lab
The objectives of this experiment are for students to acquire the ability to design a scientific experiment using dependent and indepent variables.They will also practice collecting data and drawing scientific conclusions. Brine shrimp eggs are a suitable subject for these experiments and can be used for many years, making them an excellent choice for science fairs and teaching osmosis, scientific methods, and ecology. The lab involves determining the ideal environment for hatching brine shrimp
Subjects:
Grades:
8th - 10th
Types:
NGSS:
MS-ESS3-4
, MS-ESS3-3
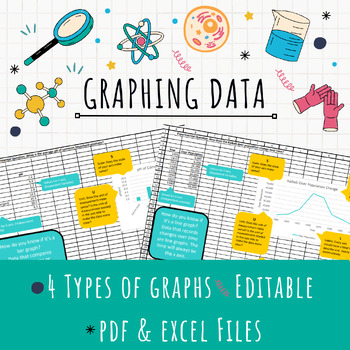
EDITABLE Excel Graphing Template
Teach graphing in Excel with this EDITABLE template! After collecting data, have your students represent it in a formal graph using Excel. This template provides helpful tips for students to determine the right kind of graph (bar, line, or pie) for their data and ALSO teaches them all the important parts of a graph.Assign the template for students to download and edit for a quick graphing solution or provide the pdf handouts for students who just need a little guidance!4 different kinds of graph
Grades:
7th - 12th
Types:
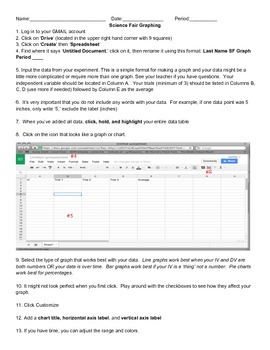
How To Graph Using Google Spreadsheets
This is a step-by-step guide on how to use Google Spreadsheets for students in grades 5-12. Use this as a resource when guiding students through the process. Included with the directions is sample data for students to use when practicing graphing. Perfect for science experiments and science fair!
Subjects:
Grades:
5th - 12th
Types:
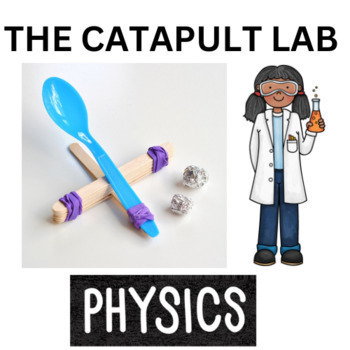
Physics Fun Catapult Lab High School Science STEM
Can't get enough of the siege weapons labs? Here is the best one on TPT!Classroom Tested for many years.Please see preview and feel free to ask any questions!The STEM aspect of this activity can be highlighted by making predictions. Which object will fly the farthest? Which angle works the best? Keep a record of your results.Using catapults to test physics The main objective of this lesson is to collect, organize, and analyze data.The popsicle stick catapult is a classic science class activity f
Subjects:
Grades:
9th - 12th
Types:
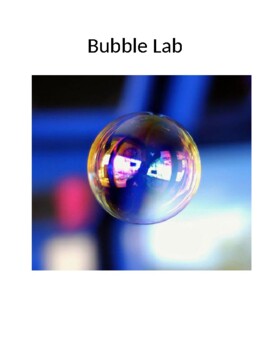
Scientific method bubble lab independent, dependent, controlled variables
STEM This is a great lab that follows the steps of the scientific method independent variable, dependent variable, and controlled variables while blowing bubbles The students absolutely love this lab and can practice using measuring and creating a data table Perfect for middle and high school students!!! Great lab for any science class! A terrific way to include math in your science curriculum Please view my previewMaterialsDishwashing Soap Brand A, B, and CStrawsBeakerPlastic SpoonMetric Ruler
Subjects:
Grades:
7th - 12th
Types:
NGSS:
MS-ETS1-2
, MS-ETS1-4
LAB ACTIVITY: ATOMIC STRUCTURE
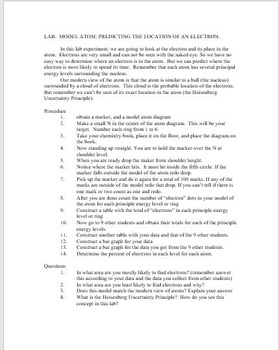
This lab is a fun and easy way to demonstrate a few concepts concerning atomic structure namely the modern view of the atom (simplified) and Heisenberg's Uncertainty Principle. the students will need only the provided target diagram and a pen, though they may go through several pens. I used the cheap pens with the fine points. You can use cheap markers just make sure you have enough of them as the tips tend to break. Use fine tip markers this reduces the amount of splatter that can occur. Th
Subjects:
Grades:
7th - 12th
Types:
Showing 1-24 of 125 results


