50 results
Physical science laboratories for Microsoft Excel

BACK TO SCHOOL BUBBLEGUM SCIENCE LAB
Break the ice of the first few days of back to school science class, while teaching your students your expectations of how to write an excellent lab report. This fun, high interest student lab does just that. In groups of three, students will chew bubblegum and measure the bubbles to see if sugar free bubblegum makes bigger bubbles than regular bubblegum. Students can collect their data on the form provided and use our pre-formatted Microsoft Excel spreadsheet to create a line chart and colu
Subjects:
Grades:
7th - 12th
Types:
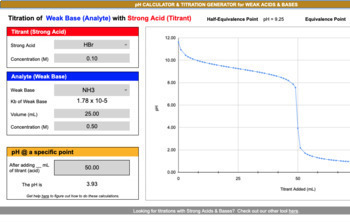
pH Calculator & Titration Curve Generator - WEAK Acids & Bases
We created this useful online titration curve generator and pH calculator tool so that you can enjoy effortless, reliable and quick acid-base titration reaction calculations. In addition to viewing the titration curve generated from a variety of weak acid and base choices, the major points on the curve are also included: equivalence and half-equivalence points. Interested to know the pH at a specific point according to different volume and molarity inputs? You are in luck. This tool allows you
Subjects:
Grades:
7th - 12th, Higher Education, Adult Education
Types:
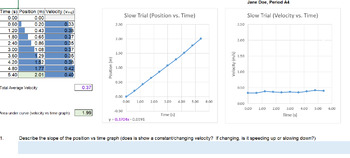
Water Droplet Velocity and Displacement Activity
This is a fairly simple to perform data collection activity to illustrate the concepts of one-dimensional motion and the associated graphing techniques. Students will use plastic water bottles to perform a series of motions and collect data. The data can then be analyzed using included Excel automatically calculating workbooks in two follow-up lessons. This activity can easily be performed in a distance learning setting as it uses materials found in most households.
Subjects:
Grades:
8th - 12th
Types:
CCSS:
NGSS:
HS-PS2-1
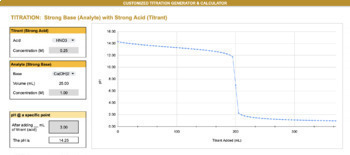
pH Calculator & Titration Curve Generator - Strong Acids & Bases
Create your own customized titration curves within seconds for worksheets, assessments, handouts or any other use!This resource comes with TWO generators/ calculators: 1. A titration of a strong acid with a strong base and 2. A titration of a strong base with a strong acid The customized generator allows YOU to CHOOSE:Chemical identity of the titrant AND analyteVolume of analyte being titratedConcentration of the analyteConcentration of the titrantPick and choose what combinations you
Subjects:
Grades:
6th - 12th, Higher Education
Types:
NGSS:
HS-PS1-7

Waves Lab Electronic Notebook : ELN: Waves Unit
Electronic/Digital Lab Notebook in Google Sheets, Numbers and Excel. I created this to streamline the Lab Process. It can be paired with IoT sensors.This Lab Notebook is divided up into a Dashboard, Pre-Lab Inquiries, Observations Log, Data Analysis, and Post-Lab Inquiries.This meets the Scientific Process and Science Inquiry requirements. The Observation Log houses the unit's vocabulary with links to the definitions so students can reference itas they enter data. There is an automatic graph, Ti
Grades:
6th - 12th
Types:
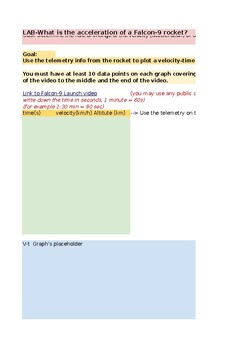
Study the acceleration of a Rocket - video analysis
Use video analysis to measure the acceleration of a falcon 9 rocket. How to determine the position, velocity, and acceleration of the rocket over time? How to use the data collected to analyze the rocket's motion? This lab activity is divided in four main sections, Introduction, data collection and data plotting , Analysis questions, and post-lab questions. any online source showing telemetry from a rocket launch may be used.
Subjects:
Grades:
9th - 12th, Higher Education, Adult Education, Staff
Types:

Structures: Easy Lab and Graph
For 3rd or 4th graders, using simple, readily available materials, students conduct tests of the strength of strands of spaghetti and then graph their results. This lab is best conducted with partners, but it could also be an independent project. Many extensions are possible. A graph that you can use with this lab is included.
Subjects:
Grades:
3rd - 5th
Types:
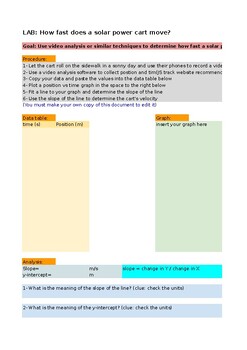
LAB - How fast is a solar cart?
Students study the motion of a solar powered cart using video analysis.Students will determine the speed of a solar cart from a position vs. time graph, and they will also be able to use the information from the chart to describe the motion. Is the velocity of the solar powered cart constant? How constant the velocity is?A video of the motion is uploaded for the video analysis, and a key is also provided. results may differ depending on the cart used.
Subjects:
Grades:
9th - 12th, Higher Education, Adult Education, Staff
Types:
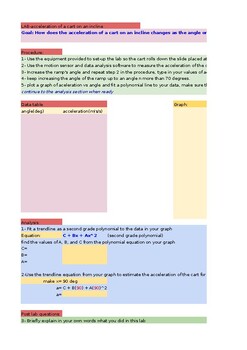
Acceleration of a cart in a ramp
Students will be able to measure the acceleration of a cart down the ramp for different inclination angles, collected data may be used to predict the acceleration of the cart for an angle of 90 degrees by extrapolation. A graph of acceleration vs. sine(angle) should yield a strait line with a slope equals to the free fall acceleration g. A key and student sample data is provided.
Subjects:
Grades:
10th - 12th, Higher Education, Adult Education, Staff
Types:
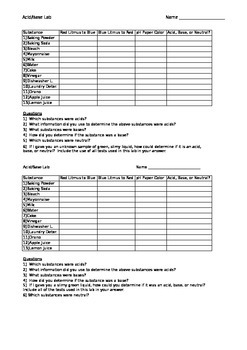
Acid & Base Lab
Use household items to test for acids and bases using litmus and pH paper
Subjects:
Grades:
7th - 12th
Types:
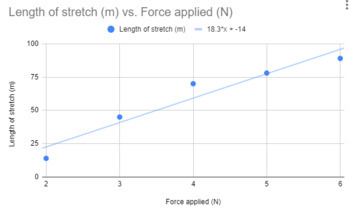
Hooke's Law graphing lab
Simple STEM focussed activity to teach Hooke's law. Students will collect data, and analyze it graphically. The lab looks at solving Hooke's law problems by graphing data and then using the graph to solve problems about each specific spring. Some basic spreadsheet skills are also taught with this exercise, as students use Google sheets to develop and analyze their graphs.There is minimal set-up required, and not much equipment is needed. Teachers will only need 5 different "springs" (rubber band
Subjects:
Grades:
9th - 12th
Types:

Human power lab - calculations
This lab allows students to workout in a weight room and measure the power of major muscle groups. There is a worksheet to record data on paper while working out, and a google sheet to automatically calculate the work done and power used for each exercise. Of course, you could have the students calculate everything themselves, but this is used as an introduction to power before we break out the calculators. The final google doc is a set of four conclusion questions.
Subjects:
Grades:
9th - 12th
Types:
Also included in: Human Power Lab Bundle
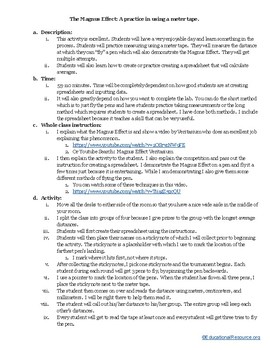
The Magnus Effect: A practice in using a meter tape
This science lab can be used in any of the science disciplines because it is going to help students learn how to read a meter tape. Students will learn what the Magnus Effect is and how to demonstrate the Magnus Effect by "flying" a hollowed-out "Bic" pen across the classroom. Students will also learn how to create a spreadsheet and then add a formula that will automatically calculate the average of their pen flight distances. I use this lab at the beginning of the year to get students excite
Subjects:
Grades:
7th - 10th
Types:
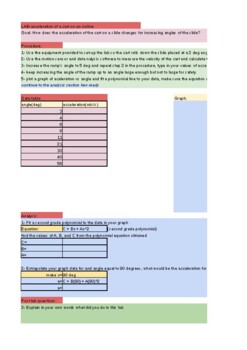
LAB-Acceleration of a cart on a tilting incline
Students investigate the acceleration of a cart down an incline for different incline angles, they will use the data obtained in this investigation to estimate the acceleration the cart would have if the angle is 90 degrees (vertical drop). This lab may be used to make the connection between accelerated motion and free fall motion.
Subjects:
Grades:
9th - 12th, Higher Education, Adult Education
Types:
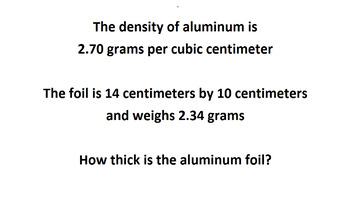
Thickness of aluminum cans through density
This folder includes these documents.
1 This document: contents and information for the teacher
2 FOR THE TEACHER: Density lab; This is your document for preparation and information. The preparation will take less than an hour.
3 EXERCISE Student data sheet with questions
4 ANSWERS Students data sheet with questions
5 ENRICHMENTAL SUPPLEMENTAL aluminum rolls
6 ANSWERS ENRICHMENT SUPPLEMENTAL aluminum rolls
7 The short video that was used as a preview. This is a higher quality versi
Subjects:
Grades:
6th - 12th
Types:
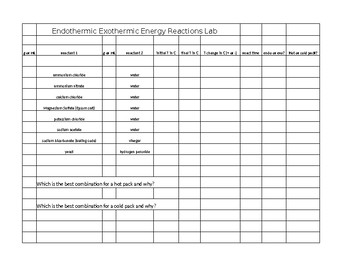
Endothermic Exothermic Energy Reactions Lab
A spreadsheet to record data for the best hot pack or cold pack
Subjects:
Grades:
Not Grade Specific
Types:
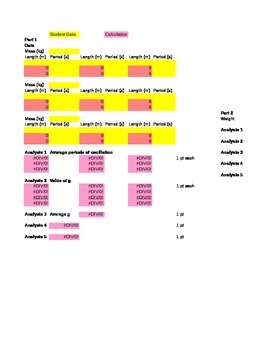
Universal Gravitation Lab Grading Spreadsheet
One of the greatest things about these labs is that each student (or lab group) is responsible for generating their own data, which leads to individual answers. The problem is that grading can be complicated…until now! These grading spreadsheets were originally only available on CD-ROM…but now they can easily be downloaded and used. When the teacher wants to grade a lab, they simply enter the student data into the yellow spreadsheet cells. Then the pink cells automatically calculate the answ
Subjects:
Grades:
7th - 12th, Higher Education
Types:
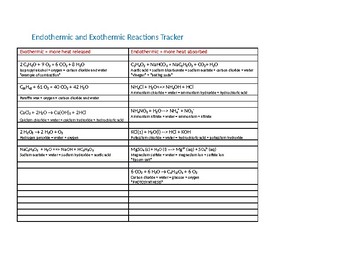
Endothermic and Exothermic Class Reactions Chart
A chart tracker for various endothermic and exothermic that can be done in class.
Subjects:
Grades:
Not Grade Specific
Types:
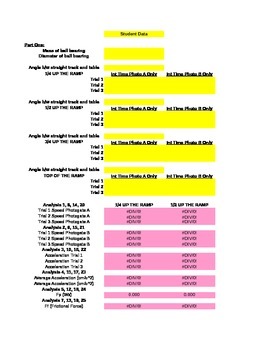
Inclined Planes and Friction Lab Grading Spreadsheet
One of the greatest things about these labs is that each student (or lab group) is responsible for generating their own data, which leads to individual answers. The problem is that grading can be complicated…until now! These grading spreadsheets were originally only available on CD-ROM…but now they can easily be downloaded and used. When the teacher wants to grade a lab, they simply enter the student data into the yellow spreadsheet cells. Then the pink cells automatically calculate the answ
Subjects:
Grades:
7th - 12th, Higher Education
Types:
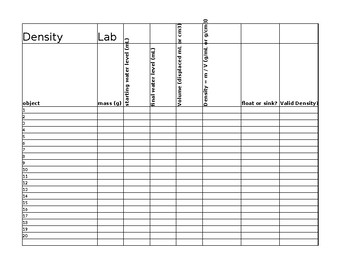
Density Lab
Lab Spreadsheet on Density, student tested with reminders
Subjects:
Grades:
Not Grade Specific
Types:
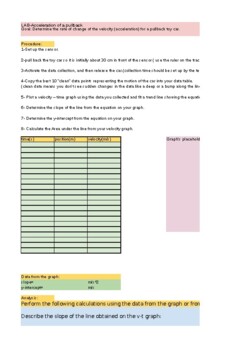
LAB-Determine the acceleration of a pull-back toy cart
In this activity student will use a motion sensor to collect the position of a pull-back toy cart. Students will use the equations of kinematic to determine the acceleration from a velocity vs time graph, or a position vs time graph. Students will use the information obtained to answer the post lab questions. Students also will learn and practice on data collection, and display using data tables and graph.
Subjects:
Grades:
8th - 12th, Higher Education, Adult Education
Types:
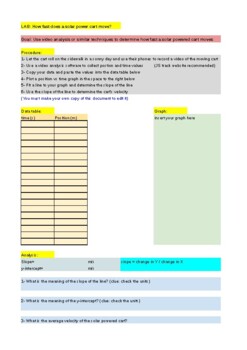
How fast is a solar powered cart?
Lab activity:Use video analysis or similar technology to measure the velocity of a solar powered cart. Students will learn how to use excel or google sheets to graph data, plot a graph and obtain information from the graph as evidence to support a claim. Students may work in groups share the work, compare and communicate their results to the rest of the class. Students explore concepts like average velocity and instantaneous velocity.
Subjects:
Grades:
8th - 12th, Adult Education
Types:
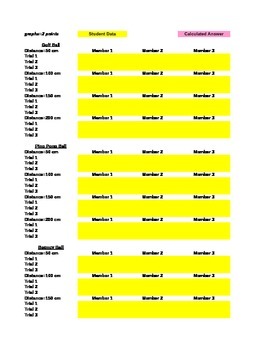
Free Fall Lab Grading Spreadsheet
One of the greatest things about these labs is that each student (or lab group) is responsible for generating their own data, which leads to individual answers. The problem is that grading can be complicated…until now! These grading spreadsheets were originally only available on CD-ROM…but now they can easily be downloaded and used. When the teacher wants to grade a lab, they simply enter the student data into the yellow spreadsheet cells. Then the pink cells automatically calculate the answ
Subjects:
Grades:
7th - 12th, Higher Education
Types:

Recording sheet for Crystal Growing experiment
A recording sheet for when students to record their observations over time when they create crystal ornaments using borax and boiling water.
Subjects:
Grades:
3rd - 6th
Showing 1-24 of 50 results


