15 results
Preschool graphing research
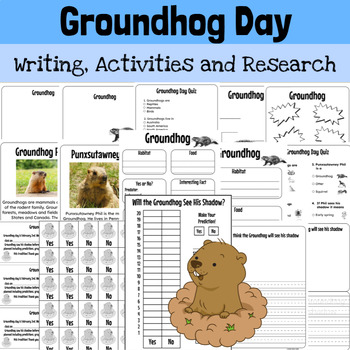
Groundhog day activities predictions research project kindergarten 1st preschool
Groundhog day activity for kindergarten, first, second grade. Includes home letter, predictions, voting, writing, graphing, research project, quiz, graphic organizers, labeling, non-fiction articles and more! Differentiation included! This resource was designed to be used for a variety of grade levels and ability levels, so for some activities (quiz, research project) you have the flexibility to choose which resources will work best with your group of students! Or mix and match to meet all of yo
Grades:
PreK - 3rd
Types:
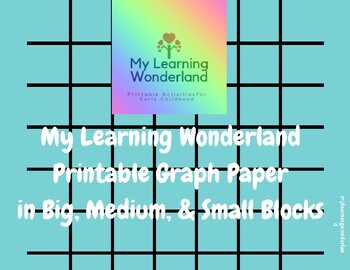
Printable Block Graph Paper Big, Medium, Small Block Sizes
Help students organize their addition, subtraction, multiplication, and division equations with three different block style graph paper. Different sizes are great for making graphs and charts in math and science! Three different sizes for students learning to master neat handwriting while organizing their thoughts.
Grades:
PreK - 5th
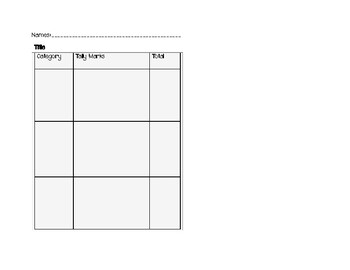
Graphing and Data
Students can complete their own surveys with tally charts, picture graphs and bar graphs.
Subjects:
Grades:
PreK - 3rd
Types:
Bird Watching
After researching various birds, I created mini books. The art of bird watching is as simple as looking at all the identification markings on a particular bird. This can be a long lesson on birds or daily lessons on each individual bird. This includes information on birds' height and wingspan. I have made different booklets for you to use with your students, depending on their level. Students love to compare the birds. Pretending the birds are real, also captures their imagination. They
Subjects:
Grades:
PreK - 2nd
Types:
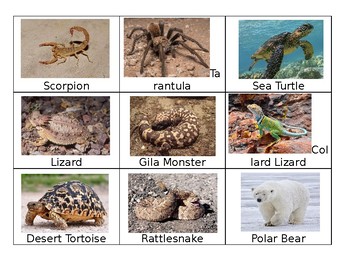
Desert Animals Vs. Non Desert
Use this document to learn about animals of the sonoran desert and compare them to animals that do not live in the desert.
Subjects:
Grades:
PreK - 4th
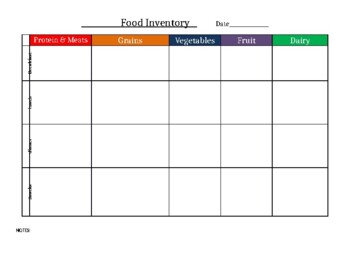
Food Inventory Daily Food and Nutrition Chart/Tracker
Food Inventory Daily Food and Nutrition Chart/TrackerSee preview for setup!
Subjects:
Grades:
PreK - 12th
Data Collection Graphs
Use this resource to support your students understanding of data collection and graphing information. Have students survey their classmates or conduct whole class surveys using the graphs and images included. Plot student responses on the graph and help your students interpret the information.Included topics:- Favourite Colour- Most Common Eye Colour- Most Common Hair Colour- Favourite Fruit- Most Common PetFeedback, suggestions and comments always welcomed! Don't forget leaving feedback earns y
Subjects:
Grades:
PreK - 3rd
#BIGGAME202 Groundhog's Day Mini Unit
This is a ELA and Math mini unit. This unit includes 27 pages of activities of which most are in both color and black and white for your convenience. The activities included are:
Groundhog’s Day Write the Room
Groundhog Can, Are, Have Brace Map and Recording Sheet
Groundhog Research Book
Groundhog Positional Book
Will the groundhog see his shadow? graph and recording sheet.
Subjects:
Grades:
PreK - 2nd
Types:
Animal Report
Use this printable report for students to fill out their own animal report. Learn brain storming, art, labeling, life cycle, babies, characteristics, food chain, venn diagrams to compare and contrast, and habitat. This printable will allow students to build a comprehensive knowledge of a specific animal.
Subjects:
Grades:
PreK - 5th
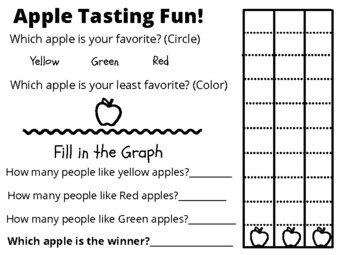
Apple Tasting Graph
Kids will love this fun apple tasting activity! Cut up yellow, green, and red apples and let the child taste one of each. Then, use this graph to record their favorite and least favorite apples. Graph the entire class/family's favorites and find out which apple takes the prize!
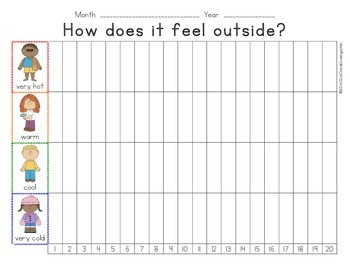
Temperature Graph for Data Collection
With this temperature graph students can record how it feels outside. Students might debate whether it feels 'very hot' vs. 'warm', but you can show them how to access the actual temperature online or on your phone. The temperature graphs are pre-made, but the consistent format supports students in noticing trends and data change over extended time (many months). This is a great addition to your math routines/ class jobs. It really supports authentic discussion and promotes a strong community of
Subjects:
Grades:
PreK - 1st
Types:
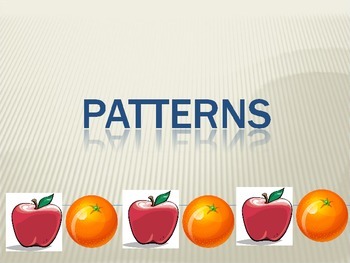
Teaching Pattern Powerpoint
A quick and simple way to introduce patterns to young students!
Subjects:
Grades:
PreK - 2nd
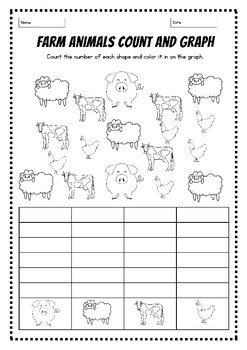
Farm Animals Count and Graph
Count the number of each shape and color it in on the graph.Farm Animals and Graph Worksheets, Farm Animals Printable Activities, Farm Animals Activity, Farm Animals Activity, Learn to Count, Math Game
Subjects:
Grades:
PreK - 1st
Types:
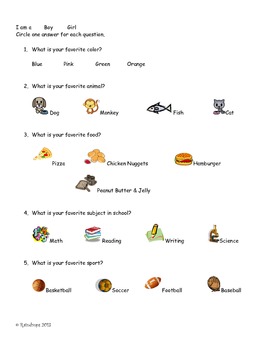
Data Survey
General interest survey with pictures. Could be used to collect data for charts and graphs for your math class.
*Created for you by Raindrops.
Subjects:
Grades:
PreK - 4th
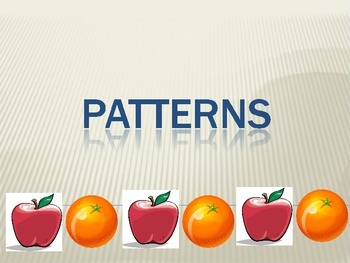
Teaching Patterns
A quick and simple way to introduce patterns to young students!
Subjects:
Grades:
PreK - 2nd
Showing 1-15 of 15 results


