39 results
Middle school statistics simulations
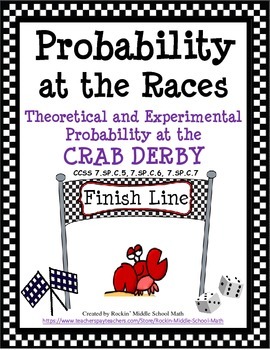
Probability-Theoretical and Experimental-Crab Derby Race CCSS 7.SP.C.5, 6, and 7
This is a fun, engaging 3 part activity including lesson plan that will have your kids so engaged they will forget they are actually learning math. Students will first work in groups/partners and simulate a crab derby race in a game using the sum of two dice to see whose crab will cross the finish line first. Then, they will complete a matrix of possible outcomes when two dice are tossed and added together to get particular sums. They will answer questions that apply to both theoretical and e
Subjects:
Grades:
5th - 9th
Types:
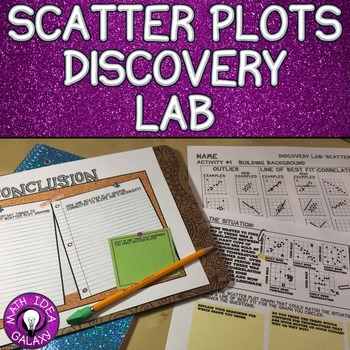
Scatter Plots Lesson - Discovery Lab
A great lesson to introduce scatter plots is by having your students participate in a discovery lab. They will get to see the topic and discover it on their own in an engaging collaborative activity.
This resource includes:
-Background Building Activity
-A Discovery Activity
-Reflections Section
Subjects:
Grades:
6th - 8th
Types:
CCSS:
Also included in: Scatter Plots Activity Bundle
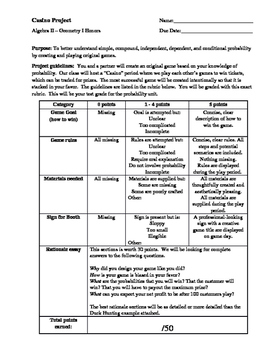
Carnival Probability Project
A project that feels like a game!
Students must create their own game, using probability to ensure THEY are favored to win....much like the house in a casino. Students can make games involving dice, spinners, cards, "fishing" ducks out of a pond, etc.
Assessed skills include: fundamental counting principal, theoretical probability, experimental probability, independent events, dependent events, creativity, writing, presentation. *Students must already know basic probability to complete this
Subjects:
Grades:
8th - 12th
Types:
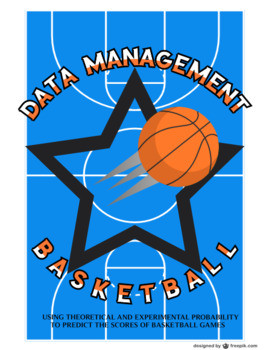
The Ultimate Basketball Learning Activity & Game - Data Management & Probability
DATA MANAGEMENT AND BASKETBALL!Can be used as a performance task for Data Management and Number Sense and Numeration! Want an exciting and fun activity to get students interested in Data Management? This is the resource for you! Combining competitive gameplay, exciting research, and fun this activity is a surefire way to get your class interested in Data Management. You'll create player profiles and using experimental probability determine the outcome of basketball games played between your
Subjects:
Grades:
5th - 12th, Adult Education
Types:
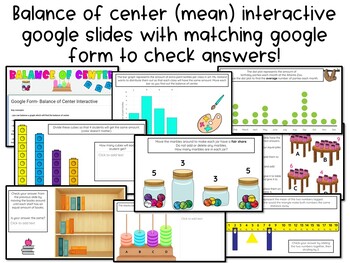
Balance of Center | Mean as Fair Share Interactive Google Slides w/ Google Form
18 slides of different interactive activities giving students an opportunity to move around online math manipulatives to find the balance of center and mean as fair share. There is a google form that goes along with the slides so students can get instant feedback. Examples:- balancing a bar graph- balancing a dot plot- sharing money to find the fair share between four friends- moving marbles around in different jars to find the mean of marbles per jar- moving snap cubes to balance the four grou
Subjects:
Grades:
3rd - 8th
Types:
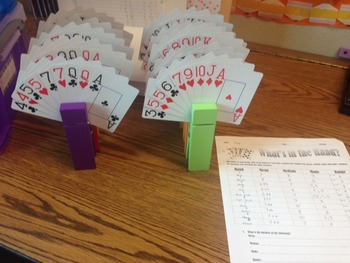
Statistics Mode, Median, Mean, Range Worksheet for Math or Psychology
What's in the Hand: Activity makes learning mode, median, mean, and range fun. You will need two packs of playing cards in order to use 10 different variations. I use giant clothes pins to hold a total of 9 cards for each station. Each student gets a worksheet and is assigned to a group of 4-5 students. Students will complete the first rotation by figuring the mean, median, mode, and range, and then rotate to each other station in about 5 min intervals. At the end they will answer the questions
Subjects:
Grades:
5th - 12th
Using Probability to Teach Social Justice
This is an exploratory experiment/activity about basic probability. Students discover the differences between theoretical probability, experimental probability, and reality by taking a hard look at Stop and Frisk in urban areas. Students also deal with independent and dependent events.
By the end of the project, students will be able to:
Articulate the differences between theoretical and experimental probability through prediction and experimentation.
Articulate the differences between indep
Subjects:
Grades:
8th - 12th
Types:
CCSS:

Casino Probability Project
Have your students demonstrate their understanding of probability by setting up a casino in your classroom with games created by the students. The casino currency can be candy, manipulative counters, or pennies (to be returned at the end of class).
Subjects:
Grades:
7th - 12th
Types:
Fantasy Baseball by Josh Hammond
This exciting and interactive unit is based in the Common Core State Standards - specifically covering the Statistics and Probability domain for 6th and 7th grade.
There are 10 lessons in all that teach students about probability, mean and median, statistical variation, and much more. Students will also build a team of players from scratch, participating in a live auction to do so. Students will then play interactive games against each other, and keep track of the player statistics through it a
Subjects:
Grades:
5th - 8th
Racial Profiling and Probability (Social Justice Math)
In this assignment, you will investigate racial profiling, or Driving While Black (DWB). African Americans and Latinos/as have complained, filed suit, and organized against what they believe are racist police practices—being stopped, searched, harassed, and arrested because they “fit” a racial profile—they are African American (Black) or Latino/a (Brown). But is this true? How do we know? And can mathematics be a useful tool in helping us answer this question?These questions will be answered usi
Subjects:
Grades:
7th - 12th
Key Performance Indicators Data Dashboard - Final Project
Student assignments are in three parts:Part 1: Print out KPI graphic organizer on 11x17 for students to draw sample charts showcased on presentation slides.Part 2: Virtual graphic organizer practice on Canva.Part 3 (this purchase): Final KPI Dashboard Canva template.
Subjects:
Grades:
8th - 12th, Higher Education, Adult Education
Types:
Also included in: Key Performance Data Dashboards Bundle
Winter Olympics - Random Number Simulation with Experimental Probability!
This is a collaborative learning activity where students will apply Random Number Simulation to see if their country will receive a medal in the next 10 Olympics!
Students will enhance their technology skills while researching past Olympic wins and losses for certain events. After compiling the existing results, students will run a simulation to gather data about the future Olympics.
Once they have gathered the data, they will find the experimental probability for different outcomes.
This is
Subjects:
Grades:
6th - 9th
Types:
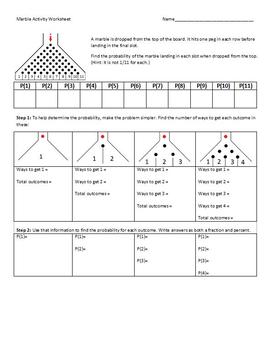
Marble Activity
Fun activity to have students investigate and calculate probability.Using a Plinko-style board, students predict where the marble will drop. Probabilities are then found by breaking the board down into smaller versions and seeing how it relates to Pascal's Triangle to be able to determine the probabilities.There are questions related to the marble drop and probability, some questions about Plinko and an extension using The Wall game show.SMART Notebook presentation, word document and pdf version
Subjects:
Grades:
7th - 12th
Types:
CCSS:
Mean Absolute Deviation
This 25-slide PowerPoint presentation describes what Mean Absolute Deviation is and how to calculate it. The lesson uses two sets of sample data that turn out to have the same mean & median and a common range. Mean absolute deviation is introduced as another measurement that will show the difference in the two data sets. The presentation is designed to have students work with the sample data as well so they can learn as they go along. Content is based on common core standard CCSS.Math.Conten
Subjects:
Grades:
6th
CCSS:
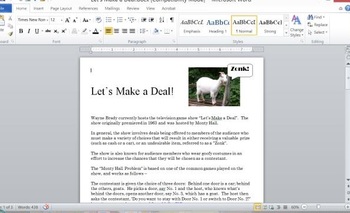
Monty Hall Problem with Fathom Simulation
A guided handout (Word document) and a Fathom Simulation file that introduces students to the famous "Monty Hall Problem" and guides students to the discovery that switching doors is always preferred!
Subjects:
Grades:
7th - 12th
Types:
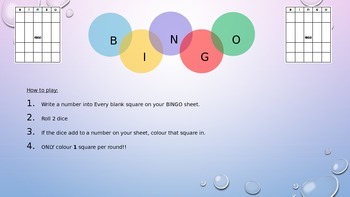
2 Dice Probability Bingo Game
Simple Bingo game where students can use a bingo game as an experiment to discover which values are the highest probability in either the sum of 2 dice or the difference of 2 dice.
Students fill in the sheets with values they think will come up. They get to fill in one square per round if the have a value that matches the sum/difference of the dice. After the first game is played, it should be played again to allow students to use their understanding to improve their chances. Eg. using more
Subjects:
Grades:
5th - 8th
Types:
Halloween Party - Math Problem Solving
In this activity, students will be planning a Halloween party for their class. They will need to "purchase" supplies for their party using a budget that you set. I set a budget that forces the students to make budget choices, i.e., I don't give them enough to buy everything they want. Students will work in partners to plan their party, making decisions based on their budget constraints. Students are also asked to perform some data analysis on the party choices. This is a good activity to do
Subjects:
Grades:
3rd - 7th
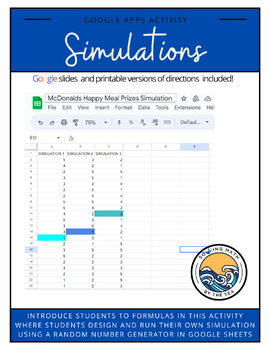
Simulations
Students will use Google Sheets and a random number generator to run their own simulation. Skills include:writing a formula in Google Sheetscreating a random number generatoranalyzing simulation results relating simulations to real-world occupations
Subjects:
Grades:
7th - 8th
Types:
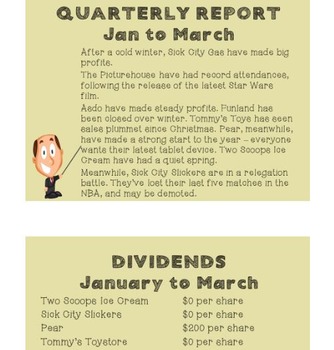
Maths activity: Stock Exchange! (Three lessons)
This maths activity has been used by my class at the end of exams - and it has been one of the most interesting and engaging maths projects I've ever been involved with. There are three years of trading, with each year taking about an hour of class time, or one lesson.
The class is split into teams of three and is given a share in each of eight fictional companies in a city called Sick City.
They then have trading windows where they can exchange their shares for those of other teams, predictin
Subjects:
Grades:
4th - 7th
Types:
Samples/Populations/Predictions FUN Math Activity Project (7th grade) EDITABLE
This is a great project to use as an in class activity to review making predictions based on samples. You could use this as an individual or group assignment. It would also be very easy to assign online, if you have students learning in the virtual setting.
Subjects:
Grades:
7th
Types:
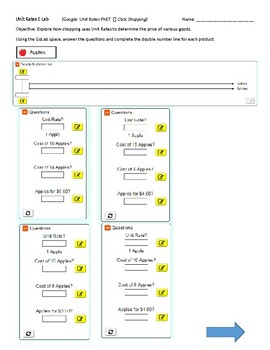
Interactive Online ELab Simulations Lab - Shopping Unit Rates Lab
In this FREE online interactive simulation provided by PhET, developed by the University of Colorado, students will explore unit rates through the process of buying goods. Students will explore how shopping uses unit rates to determine the price of various goods. Students will need a computer, tablet or IPad. These simulations were designed for IPad use. This handout goes directly with the Elab and contains directions on accessing the lab online as well as directions on how to complete the lab.
Subjects:
Grades:
5th - 8th
Types:
Game Theory and Drama for Kids
Most kids are convinced math is boring. Use drama and humour to get them doing (university level) strategic thinking and have fun at the same time. Game theory is a study of strategic decision making. In this game, kids act out the part of a judge, a bailiff, two criminals and a police officer or two. The goal is to spend as little time in jail as possible. What's the best way to do that? Play the game to find out.
With game theory and some drama thrown in, math truly can be something incredibl
Subjects:
Grades:
3rd - 8th
Types:
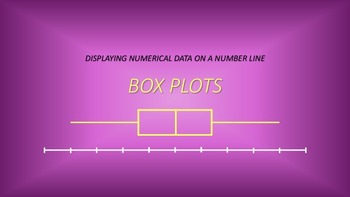
Numeric Data: Box Plots
This 29-slide PowerPoint presentation covers the basics of Box Plots in good detail. The lesson is based on math Common Core standard CCSS.Math.Content.6.SP.B.4 under the domain of Statistics and Probability. It begins with a review on number lines. The purpose & components of Box Plots are discussed next. Then, using sample data, it takes you step through step in determining the 5-number summary and constructing the Box Plot. This lesson could be used for a full class period. I recommend th
Subjects:
Grades:
6th
CCSS:
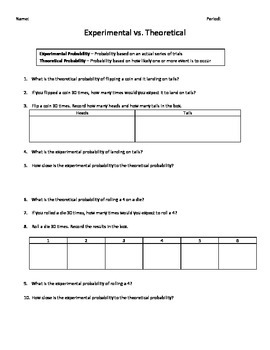
Experimental vs. Theoretical Probability Lab
This lab deals with experimental versus theoretical probability. You will need dice and coins or a simulator for these items. Please do not redistribute - send interested teachers to my TPT store. Thanks!
Subjects:
Grades:
6th - 8th
Types:
Showing 1-24 of 39 results


