23 results
Adult education Common Core 8.SP.A.4 resources
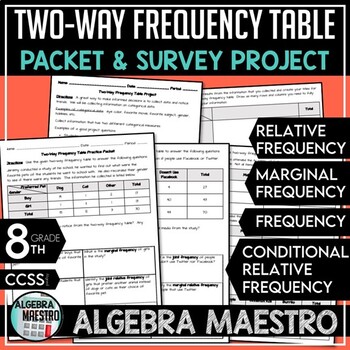
Two-Way Frequency Table Practice Packet & Project
With the Two-Way Frequency Table (or two way tables) Practice Packet & Project you'll receive:-3 pages of student practice via packet-3 pages of the answer key for the packet-2 pages for the student driven projectThe Two-Way Frequency Table Packet and Project are meant to be a review and reinforcement activity. Students can practice and further enhance their understanding using the Packet Practice. Teacher may want to further differentiate the content for advanced students and give them th
Subjects:
Grades:
7th - 12th, Higher Education, Adult Education
Types:
CCSS:
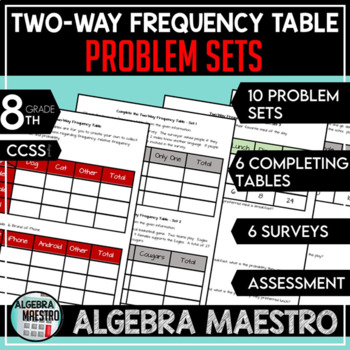
Two-Way Frequency Table Problem Sets
The Two-Way Frequency Table (or two way tables) is designed to give students a lot of practice so they can fully understand and master two-way frequency tables. Included: 10 problem sets (40 total problems), 6 completing tables problem, 6 surveys to collect & analyze data, an assessment, and answer keys to every activity. These are great activities to get students to understand statistics and relationships including ratios, fractions, probability, and develop critical thinking and reasoni
Subjects:
Grades:
6th - 12th, Higher Education, Adult Education, Staff
Types:
CCSS:
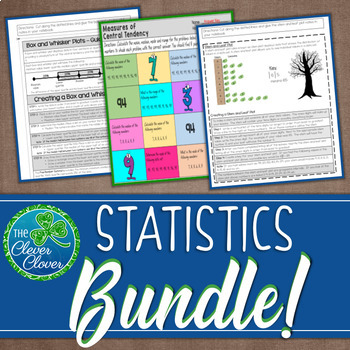
Statistics Bundle - Guided Notes, Worksheets & Scavenger Hunts!
Are your kids studying the measures of central tendency, box and whisker plots, stem and leaf plots, two-way tables, histograms and scatter plots? This valuable resource includes guided notes, worksheets, scavenger hunts, assessments and more that you can use for your statistics unit. Below you will find a brief description and link of each resource.
Measures of Central Tendency - Guided Notes, Worksheets and Scavenger Hunts
This resource includes guided notes, practice worksheets and two scave
Subjects:
Grades:
6th - 9th, Adult Education
CCSS:
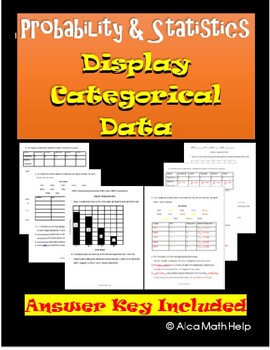
Categorical Data Display Pie Chart & Bar Chart: Worksheet, CW, HW CP & AP Stats
If you are looking for an easy to follow for students. You are at the right place. This is a quick and easy to follow activity sheet that brings across the concept clear and precise. Teachers in my department love this activity sheet. This is useful of CP Probability and Statistics, AP Statistics and Algebra 1 statistics unit. Categorical data and Display Variables ObjectivesAt the end of the lesson students should be able to:1. Correctly define categorical and quantitative data with examples2.
Subjects:
Grades:
8th - 12th, Higher Education, Adult Education, Staff
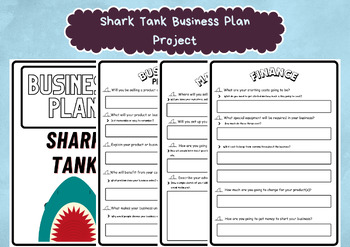
Shark Tank Business Plan Project - Business Strategy Roleplay Game for Kids
Here is what you get:7 pages of Shark Tank Business Plan Project, a fun activity to teach kids about business planning. It can also be a roleplay game where the teacher can be the judge and let students present their projects.All of the products of WorksheetGuardian has been prepared by İrem Kurt, who is the creator of this store.PLEASE NOTE:This is a DIGITAL FILE INSTANT DOWNLOAD only,printable in an array of standard frames sizes.No physical product will be shipped.After checkout you will be d
Grades:
4th - 12th, Higher Education, Adult Education, Staff
Types:
8th Grade Math Common Core Released Questions Slides
This product includes slideshows for each of the major Common Core standard strands for 8th-grade math. It includes learning targets/goals and released state test questions. The slides can be used as a teaching resource OR can be assigned to students through Google Classroom to have them complete each question.There are a total of 4 slideshows including:The Number SystemExpressions and EquationsFunctionsGeometryStatistics and ProbabilityThis is also a great resource to have as a teacher going in
Subjects:
Grades:
8th - 12th, Higher Education, Adult Education
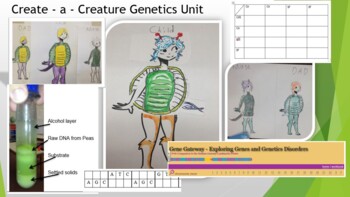
Create - a - Creature Genetics Unit
This whole unit covers the basics of genetics! It includes the Create a Creature lab, home genetic test, Punnet Squares, webquest, and final test!You can also extract DNA from dried peas; practice reading DNA and RNA; explore genetic disorders through the Human Genome Project webquest; and explore pedigree charts! You will have to create your own shell and tail pieces this. The original artist has gone on to draw a Google doodle ! You can also have the students design their own shell / tails. Th
Subjects:
Grades:
7th - 12th, Higher Education, Adult Education
Types:
NGSS:
HS-LS3-3
, HS-LS3-1
, MS-LS4-3
, MS-LS4-1
, HS-LS4-2
...
Also included in: Hands-on Science Semester Labs Bundle
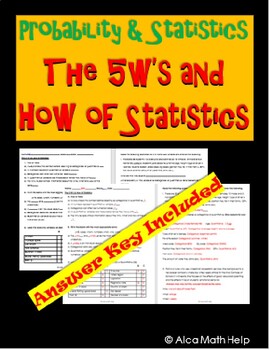
The 5W's & How of Statistics Worksheet, CP Stats, AP Stats, HW, Back-to-School
If you are looking for an easy to follow for students. You are at the right place. This is a quick and easy to follow activity sheet that brings across the concept clearly and precisely. Teachers in my department love this activity sheet. This is useful for CP Probability and Statistics, AP Statistics and Algebra 1 statistics unit.5W’s and How ObjectivesAt the end of the lesson students should be able to:1. Recall the history of statistics2. Define the 5W’s and How of statistics with examples3.
Subjects:
Grades:
8th - 12th, Higher Education, Adult Education, Staff
CCSS:

Game Templates Bundle
This Bundle includes Templates to create your own games! You can use this for any subject, any grade level! This is a great investment since you can use the templates over and over again!Game Templates included are:Connect 4MonopolyScrabblePac-man Race If you ever need any help with any of the templates and creating your own games with them, please reach out to us! We are happy to help!contact@middlemathenthusiast.com
Subjects:
Grades:
PreK - 12th, Higher Education, Adult Education, Staff
Types:
NGSS:
MS-ESS3-2
, MS-ESS3-1
, MS-ESS3-5
, MS-ESS3-4
, MS-ESS3-3
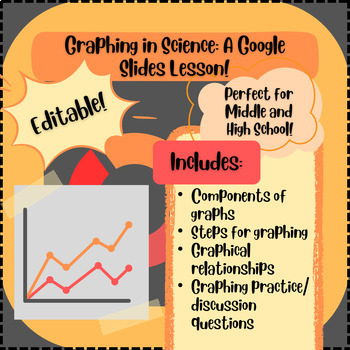
Graphing in Science: A Google Slides Lesson PLUS Guided Notes Handout!
This EDITABLE Google slides (powerpoint) presentation AND guided notes handout covers all of the essential information students need to create and analyze graphs in science. This lesson is designed to refresh students on the concepts of creating graphs using scientific data, analyzing relationships between independent and dependent variables, and includes lots of examples and practice opportunities! This lesson can be used to introduce the important concepts of graphing in science, or it can be
Subjects:
Grades:
5th - 12th, Higher Education, Adult Education
CCSS:
Also included in: Introduction to Science: Unit Bundle! No Prep Required!
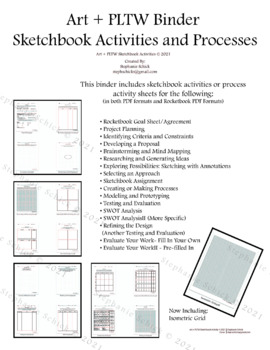
PLTW, Science and Art Processes and Activities Binder
Art + PLTW + Science BinderSketchbook Activities and ProcessesThis binder includes (in both PDF formats and Rocketbook PDF Formats) sketchbook activities or process activity sheets for the following:• Rocketbook Goal Sheet/Agreement• Project Planning• Identifying Criteria and Constraints• Developing a Proposal• Brainstorming and Mind Mapping• Researching and Generating Ideas• Exploring Possibilities: Sketching with Annotations• Selecting an Approach• Sketchbook Assignment• Creating or Making Pro
Grades:
6th - 12th, Higher Education, Adult Education
Types:
NGSS:
MS-ESS3-2
, MS-ETS1-2
, MS-ESS3-1
, HS-ETS1-2
, HS-ETS1-3
...

GOTV Get Out The Vote Postcard Campaign Project! Full Bundle!
Get Out The Vote (GOTV) Project!In this Postcard Campaign Project, we create GOTV postcards! We create and splatter alcohol inks to paint 4x6 index cards, learn the legal guidelines for GOTV efforts, discuss the importance of our campaign, and send the cards to actual voters! The Project is very Flexible and Customizable: You can trim out any part of the project you wish, or simply offer it as an optional extension project students can do on their own or as an after school club activity! Th
Subjects:
Grades:
6th - 12th, Higher Education, Adult Education, Staff
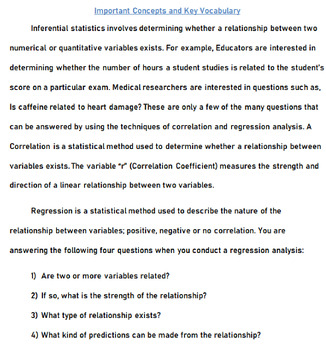
Linear Regressions in Detail
This problem set is multi-layered and accompanies the TI-83/84 Graphing Calculator (Line of Best Fit) Linear Regression Instructions. This document is comprised of the 4 following parts:- Linear regression data to read and annotate- 15 vocabulary terms to define- Regression warm up questions- 4 scenario driven problem setsThis document accompanied with the calculator instructions is great for that much needed productive struggle.
Subjects:
Grades:
8th - 10th, Adult Education
Types:

People Perfectly in Proportion: The Golden Ratio
Zip File includes - PDF and editable documentLesson Setup: This lesson can be used for students at all developmental levels. Measuring with a ruler, error analysis, and proportional thinking are a few of the skills this lesson practices. Groups can be made based upon skill requirements. Lower functioning students can perform measurements and watch higher performing students do calculations. Result could also be presented by a possible third student - if you want to do trios as opposed to pa
Subjects:
Grades:
3rd - 12th, Adult Education
Types:

TI-83/84 Line of Best Fit (Linear Regression) Calculator Instructions
Linear regressions are a very effective way to include graphing calculator technology into your curriculm. There are several online sites that can derive the regression/line of best fit for you, but where is the productive struggle in that? I have found that providing these illustrated, step-by-step notes to my students let's me just monitor and redirect; direct instruction is minimal. Like previously state, productive struggle is what we aim to provide in our classrooms. These instructions, wit
Subjects:
Grades:
8th - 10th, Adult Education
Types:
Data Foldable and Bulletin Board Trim
Directions:Bulletin Board: Print the completed terms and use for a classroom bulletin board. Cut each page into 2 terms for maximum coverage on your bulletin board.Foldable: Print the incomplete terms and hand to students. Students cut along dashed line, stack and staple along the edge. Students can then define and provide examples taken from class or at home review.Targeted Purpose or Skills:1. Engaging learning environment2. Terminology introductionTargeted Topics1. Data
Subjects:
Grades:
9th - 12th, Higher Education, Adult Education
GOTV Postcard Campaign Project - Turn and Talk Handout (to turn in)
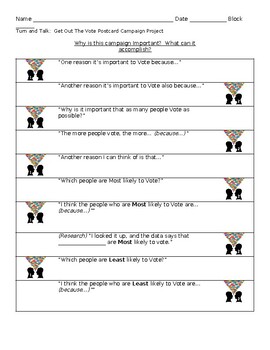
Turn-and-Talk Handout for GOTV Project:I use my "Forced Turn-and-Talk" format (in my TPT shop!).It's fully structured and prepared for you, and included in this product.This Handout and the greater GOTV Project PowerPoint slides direct students through this exercise. Of course, you can use this Handout alone.Students are guided through a Forced Turn-and-Talk to answer these Questions: Q: “Why is it important to Vote?” Q: “Why is it important that as many people Vote as possible?”Q: “Why is it i
Subjects:
Grades:
6th - 12th, Higher Education, Adult Education, Staff
Types:
Also included in: GOTV Get Out The Vote Postcard Campaign Project! Full Bundle!
Passion-Driven Statistics E-book (Introductory/AP Statistics Course Textbook)
Passion-Driven Statistics is an NSF-funded, multidisciplinary, project-based curriculum that supports students in conducting data-driven research, asking original questions, and communicating methods and results using the language of statistics. The curriculum supports students to work with existing data covering psychology, health, earth science, government, business, education, biology, ecology and more. From existing data, students are able to pose questions of personal interest and then use
Subjects:
Grades:
6th - 12th, Higher Education, Adult Education
Types:
SPSS software Secondary Data Analysis Workshop (Introductory/AP Statistics)
This handout is intended for those interested in teaching/learning basic introductory statistics concepts to analyze real data. Students will learn how to tell a story using secondary data analysis. The handout is for SPSS and the US Longitudinal Study of Adolescent Health data set. For handouts on the data set code book and raw data file, a PowerPoint to accompany the handout, or questions please email kristin.flaming@gmail.com or ldierker@wesleyan.edu.This handout was developed as a condensed
Subjects:
Grades:
6th - 12th, Higher Education, Adult Education
Types:
STATA software Secondary Data Analysis
This handout is intended for those interested in teaching/learning basic introductory statistics concepts to analyze real data. Students will learn how to tell a story using secondary data analysis. The handout is for STATA software and the US Longitudinal Study of Adolescent Health data set. For handouts on setting up an account, the data set code book and raw data file, a PowerPoint to accompany the handout, or questions please email kristin.flaming@gmail.com or ldierker@wesleyan.edu.This
Grades:
6th - 12th, Higher Education, Adult Education
Types:
SAS software Secondary Data Analysis Workshop (Introductory/AP Statistics)
This handout is intended for those interested in teaching/learning basic introductory statistics concepts to analyze real data. Students will learn how to tell a story using secondary data analysis. The handout is for SAS (email for R, SPSS, Stata, & Python), a free cloud based system and the US Longitudinal Study of Adolescent Health data set. For handouts on setting up a free SAS account, the data set code book and raw data file, a PowerPoint to accompany the handout, or questions please e
Grades:
6th - 12th, Higher Education, Adult Education
Types:
Translation Code
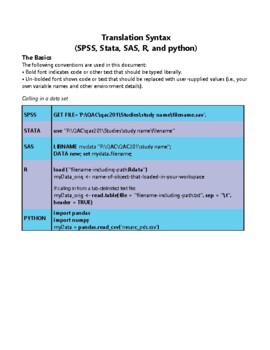
As part of our NSF-funded passion-driven statistics project, we have just started to share more widely our “translation code” aimed at supporting folks in learning code-based software and in moving more easily between them. The pdf includes all of the basic syntax for managing, displaying and analyzing data, translated across SAS, R, Python, Stata and SPSS. http://bit.ly/PDSTranslationCode.For more information about our warm and welcoming data-driven curriculum, check out https://passiondrivenst
Grades:
6th - 12th, Higher Education, Adult Education
Types:
R software Secondary Data Analysis Workshop (Introductory/AP Statistics)
This handout is intended for those interested in teaching/learning basic introductory statistics concepts to analyze real data. Students will learn how to tell a story using secondary data analysis. The handout is for R or R Studio, a free cloud based system and the US Longitudinal Study of Adolescent Health data set. For handouts on setting up a free R account, the data set code book and raw data file, a PowerPoint to accompany the handout, or questions please email kristin.flaming@gmail.com or
Subjects:
Grades:
6th - 12th, Higher Education, Adult Education
Types:
Showing 1-23 of 23 results

