66 results
12th grade Common Core 8.SP.A.4 resources

Oscar Winner -- Data Analysis & Statistics Inquiry - 21st Century Math Project
Utilize the last twenty years of Oscar winners as a data set to guide your students through creating box and whisker plots, histograms, and exploring mean, median, and mode -- in one 21st Century Math Project!Does the age of the award winning star in a film relate to the overall gross of the movie? Student will explore this inquiry question and use the data to support their conclusion.In this 8 page document you will be given a mapping to the Content Standards, an outline for how to implement t
Subjects:
Grades:
6th - 12th
Types:
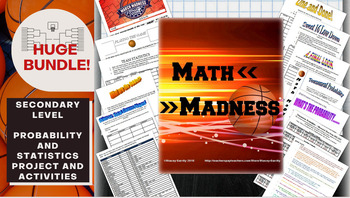
Math March Madness Full Tournament Project {BUNDLE}
Harness the excitement of NCAA March Madness with this huge project for secondary math teachers that follows all stages of the tournament! This Common Core aligned bundle comes with bonus parts not sold individually in my store so you can create a rich immersion in the tournament, practice probability and statistics and learn some interesting new ones along the way! Save $3 plus get bonus content by bundling!You can pick and choose which parts you would like to incorporate, or follow my schedu
Subjects:
Grades:
6th - 12th, Higher Education
Types:
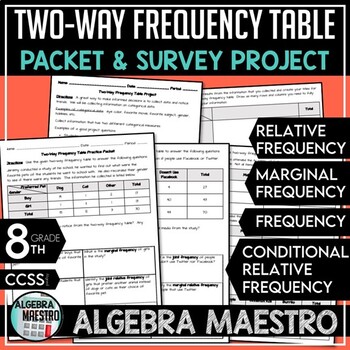
Two-Way Frequency Table Practice Packet & Project
With the Two-Way Frequency Table (or two way tables) Practice Packet & Project you'll receive:-3 pages of student practice via packet-3 pages of the answer key for the packet-2 pages for the student driven projectThe Two-Way Frequency Table Packet and Project are meant to be a review and reinforcement activity. Students can practice and further enhance their understanding using the Packet Practice. Teacher may want to further differentiate the content for advanced students and give them th
Subjects:
Grades:
7th - 12th, Higher Education, Adult Education
Types:
CCSS:
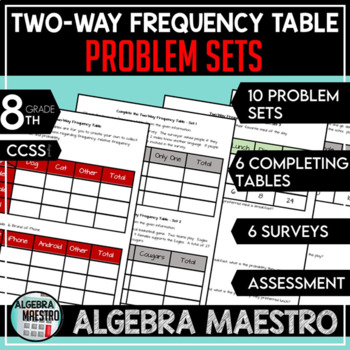
Two-Way Frequency Table Problem Sets
The Two-Way Frequency Table (or two way tables) is designed to give students a lot of practice so they can fully understand and master two-way frequency tables. Included: 10 problem sets (40 total problems), 6 completing tables problem, 6 surveys to collect & analyze data, an assessment, and answer keys to every activity. These are great activities to get students to understand statistics and relationships including ratios, fractions, probability, and develop critical thinking and reasoni
Subjects:
Grades:
6th - 12th, Higher Education, Adult Education, Staff
Types:
CCSS:
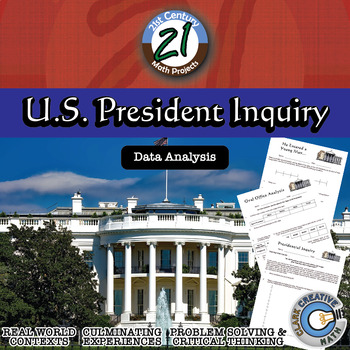
U.S. President -- Data Analysis & Statistics Inquiry - 21st Century Math Project
Engage students in data analysis through use of Presidential data in this 21st Century Math Project. Students will create box and whisker, stem and leaf, histograms and scatterplot through their investigations. In the end, students will take on the inquiry question: "Do US Presidents with the most children live longer after they have been inaugurated?" ***THIS PRODUCT HAS BEEN UPDATED WITH A GOOGLE SLIDES INTERACTIVE VERSION INCLUDED. REDOWNLOAD IF YOU HAVE IT ALREADY***-- In "He Entered a Youn
Subjects:
Grades:
6th - 12th
Types:
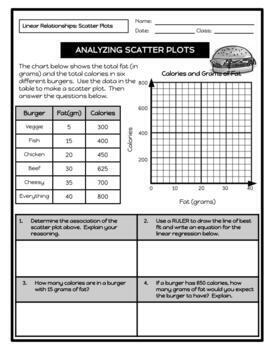
Linear Relationships (Regression): 30+ Scatter Plot Worksheets
Practice using scatter plots with 30+ activities covering the following topics:Quantitative versus Qualitative DataUnivariate Data versus Bivariate DataCausation versus Non-CausationReading a Scatter PlotDetermining Line of Best FitConstructing Scatter PlotsAnalyzing Scatter PlotsDetermining Correlation CoefficientCreating Residual PlotsIndependent InvestigationThese activities can be used as general practice, bell ringers, exit tickets, homework, and/or benchmarks. Students are required to gra
Subjects:
Grades:
8th - 12th
Types:
CCSS:
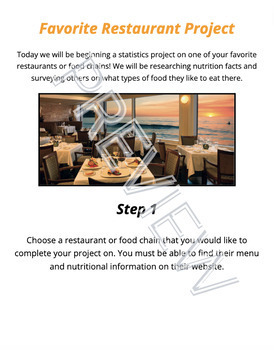
Scatter Plot and Bivariate Data Research Project
Students will begin a statistics project on one of their favorite restaurants or food chains! They will be researching nutrition facts and surveying others on what types of food they like to eat there. Through this data collection they will work on their skills of creating scatter plot graphs, creating relative frequency tables, and analyzing this data. This can be used either by paper or digitally. I used it the last two years during distance learning. Rubric included.
Subjects:
Grades:
7th - 12th
Types:
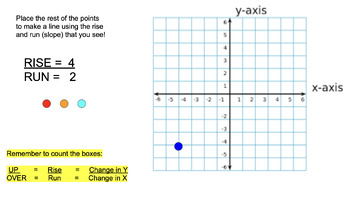
Coordinate Plane, Slope, Rise/Run, Graphing - Online No Prep Bundle
A bundle of activities which can be used as formal lessons or independent practice. Great for Google Classroom or Smart-boards! Also can be used as sub plans! Created by a Special Education Math Teacher to help students become comfortable with graphing!
Grades:
5th - 12th
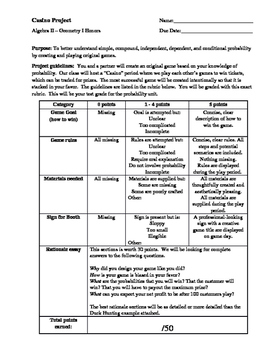
Carnival Probability Project
A project that feels like a game!
Students must create their own game, using probability to ensure THEY are favored to win....much like the house in a casino. Students can make games involving dice, spinners, cards, "fishing" ducks out of a pond, etc.
Assessed skills include: fundamental counting principal, theoretical probability, experimental probability, independent events, dependent events, creativity, writing, presentation. *Students must already know basic probability to complete this
Subjects:
Grades:
8th - 12th
Types:
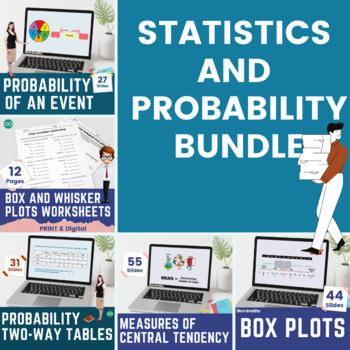
Complete Statistics and Probability Bundle | Digital and Print
This amazing statistics and probability bundle is all you need for your middle school to High school learners. From calculating averages using frequency tables to condition probability, your learners are definitely going to be immersed in their learning! Buy this high-engagement math bundle today and save hours of lesson planning time.Interactive Digital lessons inside this bundle include:Measures of Central tendencyConditional Probability - Venn DiagramsConditional Probability - Two-way tablesP
Subjects:
Grades:
7th - 12th
Types:
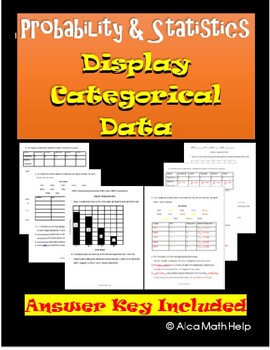
Categorical Data Display Pie Chart & Bar Chart: Worksheet, CW, HW CP & AP Stats
If you are looking for an easy to follow for students. You are at the right place. This is a quick and easy to follow activity sheet that brings across the concept clear and precise. Teachers in my department love this activity sheet. This is useful of CP Probability and Statistics, AP Statistics and Algebra 1 statistics unit. Categorical data and Display Variables ObjectivesAt the end of the lesson students should be able to:1. Correctly define categorical and quantitative data with examples2.
Subjects:
Grades:
8th - 12th, Higher Education, Adult Education, Staff
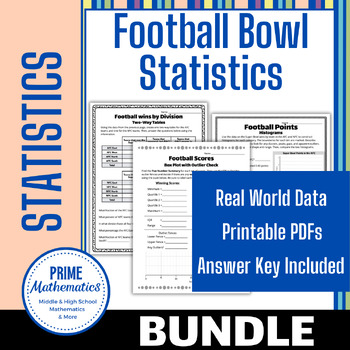
Football Bowl Statistics Super Bundle
Use statistics from previous football championships to practice finding measures of central tendency and variability and creating charts such as box-and-whisker plots, dot plots, and histograms. The students will look at football championship wins and scores. This is a super way to engage sports fans in math.The following topics are covered:Mean, Median, & ModeFive-number summaryIQR & RangeBox plots (with or without checking for outliers)Mean absolute deviationStandard deviationHistogram
Subjects:
Grades:
6th - 12th
Types:
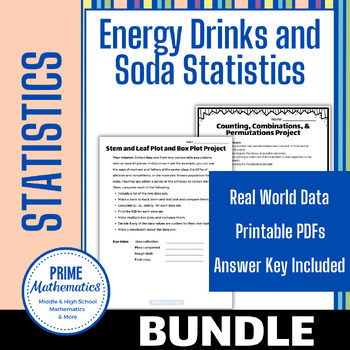
Energy Drinks and Sodas Statistics Bundle
Use statistics about energy drinks and sodas (sugar and caffeine content) to practice finding measures of central tendency and variability and creating charts such as box-and-whisker plots, dot plots, and histograms. The students will compare the amount of sugar and caffeine in energy drinks and sodas.The following topics are covered:Mean, Median, & ModeFive-number summaryIQR & RangeBox plots (with or without checking for outliers)Mean absolute deviationStandard deviationHistogramDot Plo
Subjects:
Grades:
6th - 12th
Types:
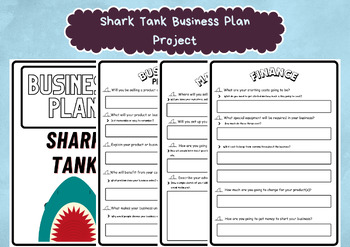
Shark Tank Business Plan Project - Business Strategy Roleplay Game for Kids
Here is what you get:7 pages of Shark Tank Business Plan Project, a fun activity to teach kids about business planning. It can also be a roleplay game where the teacher can be the judge and let students present their projects.All of the products of WorksheetGuardian has been prepared by İrem Kurt, who is the creator of this store.PLEASE NOTE:This is a DIGITAL FILE INSTANT DOWNLOAD only,printable in an array of standard frames sizes.No physical product will be shipped.After checkout you will be d
Grades:
4th - 12th, Higher Education, Adult Education, Staff
Types:
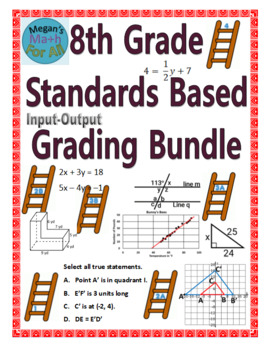
8th Grade Standards Based Grading - Bundle - Editable
Howdy,Update May 2023: Now includes 3 files: an editable Word Doc, a link to editable Google Doc, and a PDF. Do you need a set of assessments for Standards-Based Grading? Or Do you want easy to grade standards based homework assignments? This set of 12 ladders allows you to make the process of standards based grading simple and manageable for you and your students. These ladders are similar to scales but group skills and concepts to cut down on the assessment part of standards-based grading. Th
Subjects:
Grades:
8th - 12th
Types:
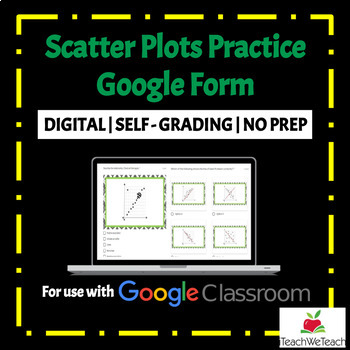
Scatter Plots | Google Forms Activity
★ DIGITAL Math Resource★ Are you looking for quality, standards aligned math resources to use with Google Classroom™? This resource is a fun and engaging way for students for practice solving problems involving scatter plots. This product includes a Google Form with 20 questions about scatter plots. Problems cover correlation type, the line of best fit and predicting scatter plot values. Possible Uses:• Practice• Homework • Assessment• ReteachCheck out my other products HERE.Please review my ter
Subjects:
Grades:
7th - 12th
Types:
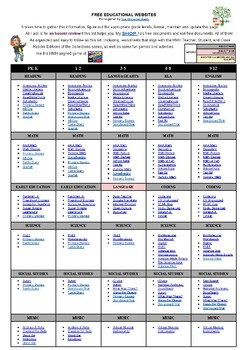
FREE EDUCATIONAL WEBSITES LIST 4 ALL GRADES K-12 AND SUBJECTS + TEACHER RESOURCE
Sometimes, you just need a list of websites for everyone. Here it is. FREE EDUCATIONAL WEBSITES Put together by Teach Me, Maria!It takes time to gather this information, figure out the appropriate grade levels, and format, maintain, and update this page. All I ask is for an honest review if this list helps you.
Subjects:
Grades:
PreK - 12th, Staff
Types:
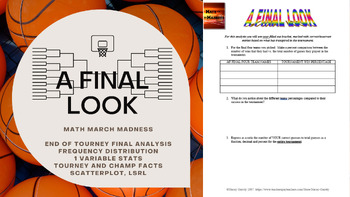
Math March Madness - A Final Look (Freq Distributions, Stats, Regression Lines)
Fill out a bracket, watch the tournament unfold and then mathematically analyze how you did! This activity is flexible enough to be used for a variety of levels. I have used all 6 pages for an AP Statistics class, and have used pages 1 through 5 for an Algebra or Algebra 2 class. You could even use it in lower levels as long as you are covering percents, and basic stats like mean, median, mode and graphing. The document is editable so you can adjust/delete to tailor to the level of statistic
Subjects:
Grades:
4th - 12th, Higher Education
Types:
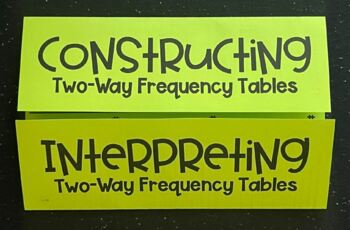
Constructing and Interpreting Two Way Tables - 8th Grade Math Foldable
This 8th grade math foldable for interactive notebooks provides students with an organized set of practice problems for constructing and interpreting two-way frequency tables. Questions are organized as follows:#1: Fill in missing value to complete the table#2-3: Use the total and percentages to create a table#4-6: Determine whether there is an association between two variables based on the relative frequencies within the table.I use this type of notes during guided instruction.This foldable is
Subjects:
Grades:
9th - 12th
Types:
CCSS:
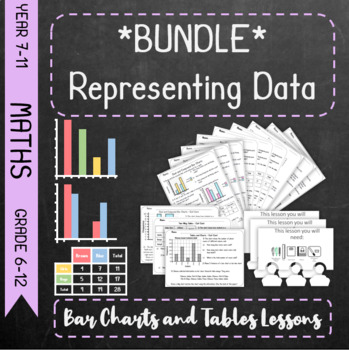
*Bundle* Representing Data - Bar Charts and Tables *Bundle*
This is a bundle featuring the following individual resources:Charts & TablesTwo-Way TablesDual and Compound Bar ChartsThese lessons are based around the scheme of work laid out by the Pearson Key Stage 3 Maths Progress DeltaCharts & Tables - Lesson on Frequency and Tally Tables and Bar ChartsTwo-Way Tables - Lesson on Two-Way TablesDual and Compound Bar Charts - Lesson on Dual/Comparative and Compound/Composite Bar Charts
Grades:
5th - 12th
CCSS:
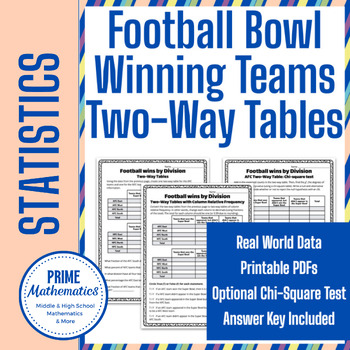
Two-Way Tables of Football Bowl Winners by Division
Use statistics about teams that have appeared in or won the Football Bowl to practice creating and interpreting two-way tables. Teams are categorized by division and whether they have appeared in or won the national pro football championship. Also, chi-square tests are included for higher-level statistics courses like AP Stats.The following topics are covered:Creating Two-Way TablesCreating Two-Way Tables of relative frequency (optional)Interpreting Two-Way TablesChi-square test for homogeneity
Subjects:
Grades:
8th - 12th
Types:
CCSS:
Also included in: Football Bowl Statistics Super Bundle
8th Grade Math Common Core Released Questions Slides
This product includes slideshows for each of the major Common Core standard strands for 8th-grade math. It includes learning targets/goals and released state test questions. The slides can be used as a teaching resource OR can be assigned to students through Google Classroom to have them complete each question.There are a total of 4 slideshows including:The Number SystemExpressions and EquationsFunctionsGeometryStatistics and ProbabilityThis is also a great resource to have as a teacher going in
Subjects:
Grades:
8th - 12th, Higher Education, Adult Education
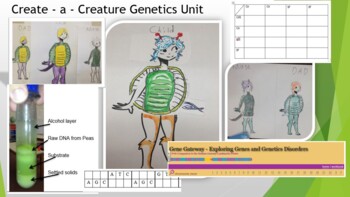
Create - a - Creature Genetics Unit
This whole unit covers the basics of genetics! It includes the Create a Creature lab, home genetic test, Punnet Squares, webquest, and final test!You can also extract DNA from dried peas; practice reading DNA and RNA; explore genetic disorders through the Human Genome Project webquest; and explore pedigree charts! You will have to create your own shell and tail pieces this. The original artist has gone on to draw a Google doodle ! You can also have the students design their own shell / tails. Th
Subjects:
Grades:
7th - 12th, Higher Education, Adult Education
Types:
NGSS:
HS-LS3-3
, HS-LS3-1
, MS-LS4-3
, MS-LS4-1
, HS-LS4-2
...
Also included in: Hands-on Science Semester Labs Bundle
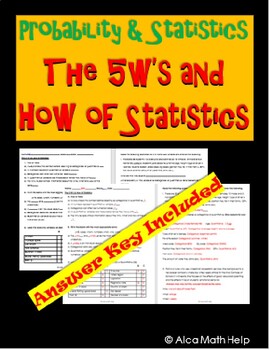
The 5W's & How of Statistics Worksheet, CP Stats, AP Stats, HW, Back-to-School
If you are looking for an easy to follow for students. You are at the right place. This is a quick and easy to follow activity sheet that brings across the concept clearly and precisely. Teachers in my department love this activity sheet. This is useful for CP Probability and Statistics, AP Statistics and Algebra 1 statistics unit.5W’s and How ObjectivesAt the end of the lesson students should be able to:1. Recall the history of statistics2. Define the 5W’s and How of statistics with examples3.
Subjects:
Grades:
8th - 12th, Higher Education, Adult Education, Staff
CCSS:
Showing 1-24 of 66 results


