8 results
Algebra graphic organizers for Microsoft Excel
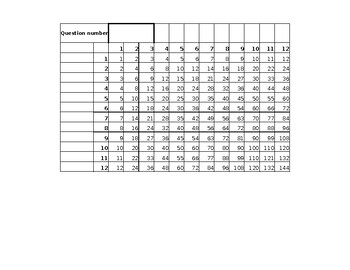
Animated Times Table
With division, fractions, and factors, this visual guide shows students that there's more than one correct path towards a multiplication answer. This spreadsheet will fill the appropriate cells with green conditional formatting if there is a number that matches what you (or a student) types into the "question number" cell. The first tab covers numbers 1-12, the second 1-20, and the third has the perfect squares highlighted at all times.
Subjects:
Grades:
Not Grade Specific
Types:
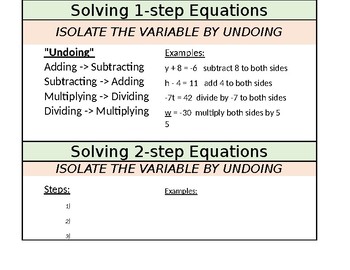
Solving 1-step & 2-step Equations Graphic Organizer
This is a graphic organizer that can be used when teaching how to solve 1-step and then 2-step equations. Both steps and examples can be notated on this organizer which can be used as a study guide for students.
Subjects:
Grades:
Not Grade Specific
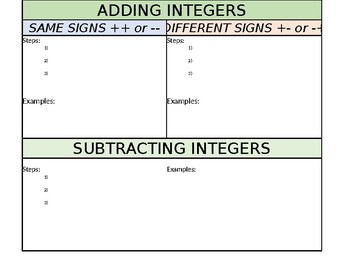
ADDING & SUBTRACTING INTEGERS GRAPHIC ORGANIZER
This is a graphic organizer to be used for students learning how to add and subtract integers. There is room for steps and examples. This can also be used as a study guide.
Subjects:
Grades:
Not Grade Specific
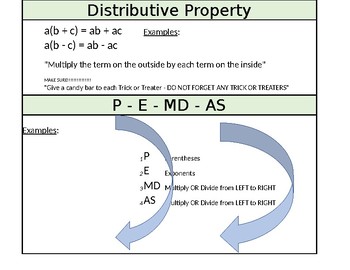
Distributive Property & PEMDAS Graphic Organizer
This graphic organizer shows both the Distributive Property with examples as well as the steps for PEMDAS with a visual. It can be used as a study guide for students.
Subjects:
Grades:
Not Grade Specific
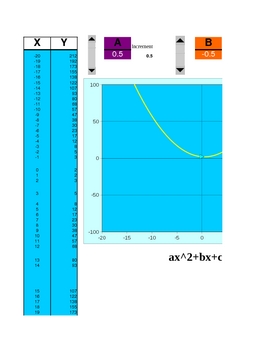
Functionator 5000 A graphing calculator/equation editor decay & growth
I built this Excel document to show what happens to lines and tables when you change variables and constants within an equations. There are three sheets:
y = mx+b
ax^2 + bx +c =0
c = p(1-r)^t
For instance, on the linear equation sheet, you can change m & b separately to see changes in the table and the graph. You can trace all equations. Much fun can be had.
Subjects:
Grades:
5th - 12th, Higher Education, Adult Education
Types:
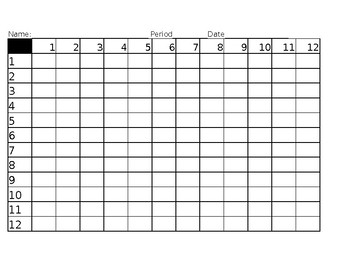
Math Multiplication table
This is a great way for students to memorize multiplication facts
Subjects:
Grades:
7th - 9th
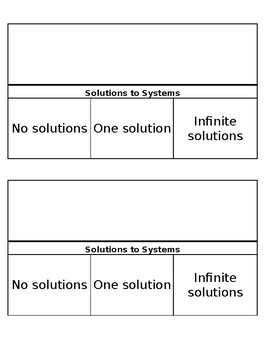
Systems of Linear Equations: Types of solutions foldable
A quick foldable for introducing the types of solutions of a system of linear equations in 2-variables. It has one solution, no solution and infinite solutions. There are 2 copies per sheet of paper. It needs to be printed or photocopied double-sided.
Subjects:
Grades:
9th - 10th

Function Input/Output Table
Use this form to help students organize information when teaching how to graph an equation or function. Pair this with a coordinate plane pdf from leading math worksheet sites for a simple worksheet on graphing.
I use this method before teaching slope/intercept form so the students see the connection themselves.
In excel so its easily editable for your preference.
Grades:
7th - 10th
Showing 1-8 of 8 results


