20 results
Common Core 6.SP.A.1 interactive whiteboards
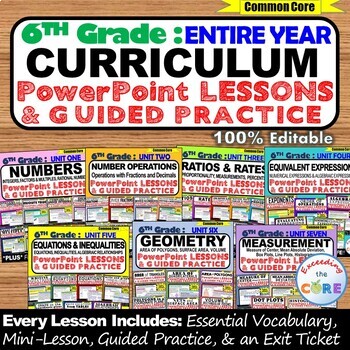
6th GRADE MATH CURRICULUM PowerPoint Lessons DIGITAL RESOURCE BUNDLE-Entire Year
Get your students successfully understanding the 6th Grade MATH CURRICULUM (all units) with this PowerPoint Presentation BUNDLE.This bundle includes 48 PowerPoint Lessons that are designed to teach the ENTIRE 6th Grade Math Curriculum. Each lesson starts with a mini-lesson and guided practice questions. Every lesson concludes with a lesson quiz and exit ticket to assess student understanding. All of the PowerPoint presentations are 100% editable, therefore you can modify any slide as needed.Thi
Subjects:
Grades:
5th - 7th
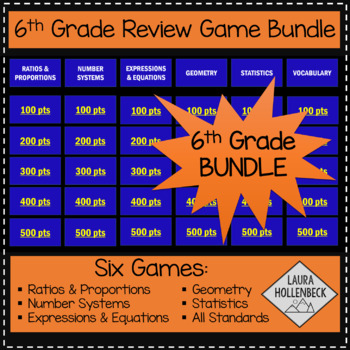
6th Grade Game Show Review Games BUNDLE
These games are the perfect way to review your units throughout the year. My students absolutely love playing jeopardy before their unit tests. The academic conversations among groups deepen knowledge and the game show format increases motivation and engagement. **FULLY EDITABLE** While the games are complete, it is also editable in PowerPoint, making it easy to add questions or change the level of difficulty based on your students' needs.This bundle includes SIX games for the price of FIVE. The
Subjects:
Grades:
6th - 7th
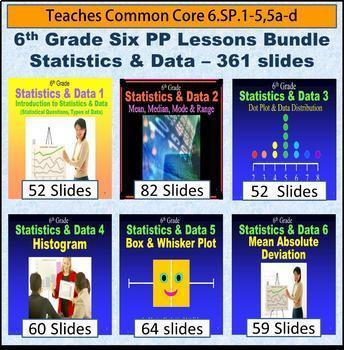
6th Grade Statistics & Data Bundle - 6 Powerpoint Lessons - 402 Slides
Sixth Grade Statistics and Data Bundle - It is composed of 6 different lessons comprising 402 slides on the following: Statistics and Data 1 - Statistical Questions and Types of Data, Statistics and Data 2 - Mean, Median, Mode & Range, Statistics and Data 3 - Dot Plot and Data Distribution, Statistics and Data 4 - Histogram, Statistics and Data 5 - Box and Whisker Plot, Statistics and Data 6 - Mean Absolute Deviation. For more information on these powerpoint lesson click on the individu
Subjects:
Grades:
6th
6th Grade Statistics & Data 1 - Statistical Questions & Types of Data Lesson
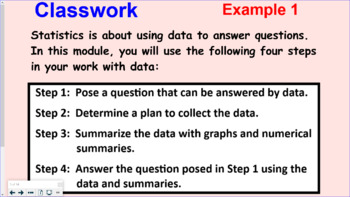
Sixth Grade Statistics 1 - Statistical Questions and Types of Data Powerpoint Lesson is powerful when used as direct instruction in the classroom, online, or individually. It teaches students how to recognize and pose a statistical question. Students also learn the difference between numerical and categorical data. They also learn the 4 basic steps in presenting data: posing a statistical question, gathering the data, displaying the data, and answering the question they posed. There are 22
Subjects:
Grades:
6th, Adult Education
CCSS:
Also included in: 6th Grade Statistics & Data Bundle - 6 Powerpoint Lessons - 402 Slides
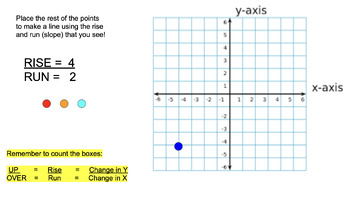
Coordinate Plane, Slope, Rise/Run, Graphing - Online No Prep Bundle
A bundle of activities which can be used as formal lessons or independent practice. Great for Google Classroom or Smart-boards! Also can be used as sub plans! Created by a Special Education Math Teacher to help students become comfortable with graphing!
Grades:
5th - 12th
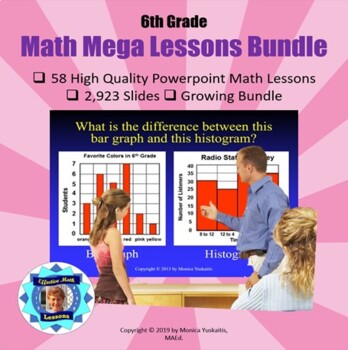
6th Grade Powerpoint Mega Math Bundle - 58 Lessons - 2923 Slides
Sixth Grade Powerpoint Math Bundle is composed of 58 different high quality math powerpoint lessons comprising 2,923 slides. These are perfect for distance learning on Zoom or similar formats. On top of that they are powerful when used as direct instruction in the classroom.There are 22 strategies of effective teaching based on research in these powerpoint lessons. . For further information on each lesson click on them individually. This is a growing bundle which means as new products are a
Subjects:
Grades:
6th, Adult Education
Statistics and Probability PowerPoint Presentation: 6.SP.1-5
This product contains 13 instructional slides related to concepts about statistics and probability in a PowerPoint presentation. The PowerPoint correlates to the "foldables" and posters in my other CCSS 6.SP products. It is just formatted differently, but the content is the same.NOTE: This product is also a part of my Complete Packaged Unit (All practice sheets, foldables, PowerPoint, Posters, Assessments, and Task Cards)!Visit Suzanne's Classroom Store! The resources are designed to enrich o
Subjects:
Grades:
5th - 7th
Also included in: Statistics and Probability: CCSS 6.SP.1-5 Bundle
Engage NY (Eureka) 6th Grade Common Core Entire Math Module 6- Topics A - D
If you love Engage NY, but are looking for a more engaging way to teach the modules, you have come to the right place! This notebook file for SmartBoard follows the 6th grade Module 6, Topics A- D, Lessons 1-22. If you like these lessons, follow me for full topic and module notebooks for other grades. Save time and energy while engaging students in common core math! These topics and lessons cover statistics. Engage NY created the modules, I made them easier to follow and more interesting f
Subjects:
Grades:
6th
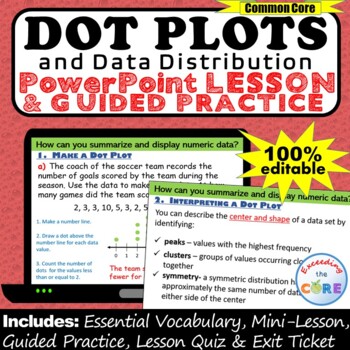
DOT PLOTS, LINE PLOTS & DATA DISTRIBUTION PowerPoint Lesson & Practice | Digital
Great for online learning and distance learning!Get your students successfully creating and using DOT PLOTS /LINE PLOTS and Data Distribution with this PowerPoint Presentation. This lesson begins with a focused mini-lesson and guided practice questions. It concludes with a lesson quiz and exit ticket to assess student understanding. All of the answers are included. This PowerPoint presentation is 100% editable, therefore you can modify any slide as needed.What is Included:_ Mini-Lesson with Gui
Subjects:
Grades:
6th - 8th
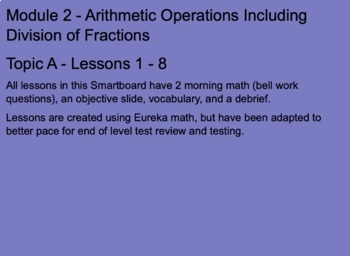
Grade 6 Math Entire Year Smartboard Bundle
This download includes 6 units of Smartboard lessons that each have daily bell work, standard based objectives, vocabulary, whole group, partner work, individual practice slides and a debrief slide. Lessons that have integrated Kagan strategies have word documents with printable Word document worksheets. There are end of module review lessons and activities (including bingo and jeopardy) in each unit.
Subjects:
Grades:
5th - 8th
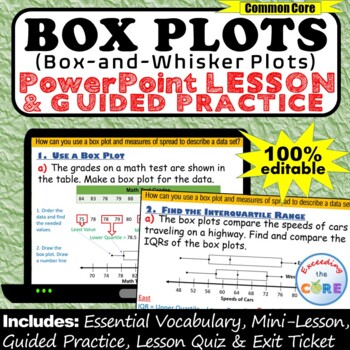
BOX PLOTS (Box-and-Whisker Plots) PowerPoint Lesson AND Guided Practice DIGITAL
Great for online learning and distance learning!Get your students successfully creating and using BOX PLOTS (Box-and-Whisker Plots) with this PowerPoint Presentation. This lesson begins with a focused mini-lesson and guided practice questions. It concludes with a lesson quiz and exit ticket to assess student understanding. All of the answers are included. This PowerPoint presentation is 100% editable, therefore you can modify any slide as needed.What is Included:_ Mini-Lesson with Guided Practi
Subjects:
Grades:
5th - 7th
Jeopardy Statistical Measures
Students can review how to properly find Mean, Median, Mode, Range, Outlier, Interquartile Range (IQR) & Mean Absolute Deviation (MAD) before an assessment.
Subjects:
Grades:
6th - 8th
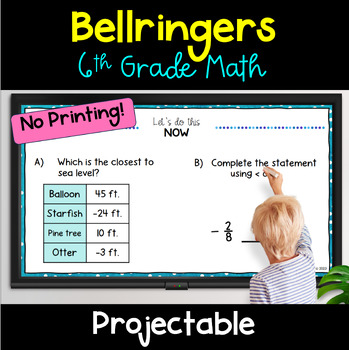
6th Grade Math Bellringers: Customizable, Warmups No Prep No Print CCSS Aligned
Simplify your life with these ready to go, CCSS aligned bell ringers! Strengthen your classroom management and increase essential math skills by making these bell ringers a part of your daily routine. 2 Options for the busy teacher: Option 1: Ready to use bell ringers. Just pick a slide and display.Option 2: Customize your own bellringers from a question bank and ready to use templateNo PrepNo PrintingCCSS AlignedMotivational quote on every slide.Strengthen classroom management with a ready to g
Subjects:
Grades:
5th - 7th
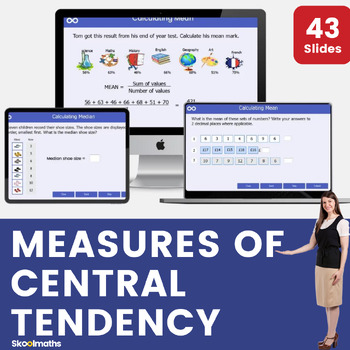
Measures of Center - Mean, Median, Mode and Range Interactive Math Lesson
Measures of Center - Mean, Median, Mode and Range Interactive Math LessonA completely interactive Middle school lesson for pupils in 6th grade on calculating averages. In this lesson, learners are able tocalculate measures of central tendency (mean, median, and mode);calculate measures of dispersion (range)understand interpretation and applicability of these measuresapply appropriate use of measures to compare data.The lesson can be used as whole class teaching by teachers and at home by learner
Subjects:
Grades:
6th - 7th
Also included in: Complete Statistics and Probability Bundle | Digital and Print
Statistical Questions Activity Manual - 6.SP.1
Discover the difference between "statistical" questions and other questions. Scaffolded lesson provides for classroom differentiation. Can be used as a lesson leader, guided practice, independent practice, for cooperative learning and math centers, or as an assessment. Use with smartboard, projector, computer, pad or as printable. Lesson is complete - NO PREP.
Objectives:
- Identify statistical questions
- Write statistical questions
- Answer statistical questions
Includes 6 problem pages and an
Subjects:
Grades:
5th - 8th
CCSS:
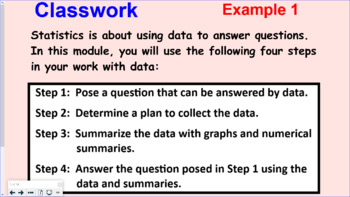
Engage NY (Eureka) 6th Grade Common Core Math Module 6-Topic A
If you love Engage NY, but are looking for a more engaging way to teach the modules, you have come to the right place! This notebook file for SmartBoard follows the 6th grade Module 6-Topic A, Lessons 1-5. If you like these lessons, follow me for full topic notebooks for more topics, other modules and grade levels. Save time and energy while engaging students in common core math! These lessons cover understanding distributions. Engage NY created the modules, I made them easier to follow and
Subjects:
Grades:
6th
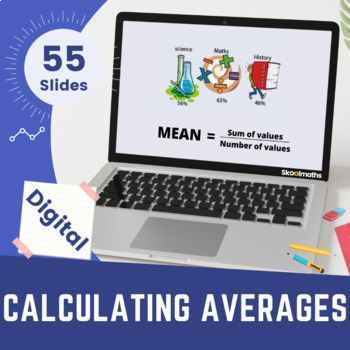
Mean Median Mode and Range Digital Activities
Find the mean, median, mode, and range of a set of data. The mean is just what it sounds like - the average of all the numbers. We need to know this because it tells us how much an amount changes. The mode is the number that appears most often in a set of data. We have the median which tells us where half the values in the data are less than or greater than that number. Lastly, the range of a set of numbers is the difference between the smallest number and the largest number in the set. Find out
Subjects:
Grades:
6th, Higher Education
Statistical Questions Interactive Presentation - 6.SP.1
Interactive Powerpoint will provide students with definitions, opportunities to differentiate between statistical questions and non-statistical questions and the ability to write statistical questions. The lesson moves step by step through the material in a way that will keep students interested and provide a basis for future learning. Use with smartboard, projector, computer, pad or as printables. Great lesson for cooperative learning or centers.
Objectives:
- Recognize statistical questions
Subjects:
Grades:
5th - 8th
CCSS:
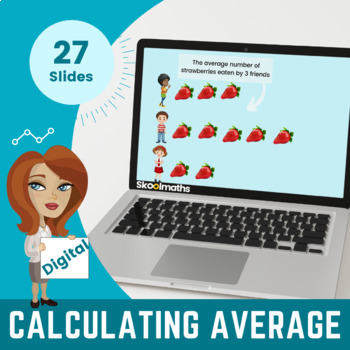
Calculating Averages - 6th Grade Digital Learning CCSS.6.SP.A.1
Want an interactive maths lesson for students that will help your sixth grade to practice Calculating Averages? In this fun-packed digital maths lesson, your grade 6 students will learn how to calculate the mean, median, and mode. This lesson is completely interactive with drag and drop activities that will engage and motivate your learners!Contents:This bundle pack contains:27 interactive slides with dynamic graphics that will engage your studentsInteractive Drag and Drop activities on find ave
Subjects:
Grades:
6th - 7th
Statistical Questions Full Lesson Bundle - 6.SP.1
Interactive Powerpoint and student activity book will provide students with definitions, opportunities to differentiate between statistical questions and non-statistical questions and the ability to write statistical questions. The lesson moves step by step through the material in a way that will keep students interested and provide a basis for future learning. Use with smartboard, projector, computer, pad or as printables. Great lesson for cooperative learning or centers.
Objectives:
- Recogni
Subjects:
Grades:
5th - 8th
CCSS:
Showing 1-20 of 20 results

