6 results
Critical thinking Common Core 8.SP.A.2 resources
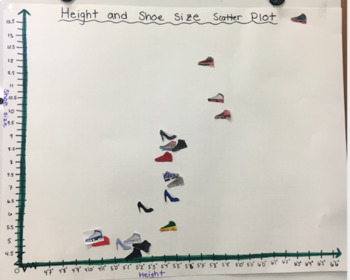
Height and Shoe Size Scatter Plot Introduction Activity
This activity is such a fun and effective way to introduce scatter plots to students! The product involves predicting, gathering data, constructing a scatter plot, and interpreting the scatter plot.This product contains a zip file as a PDF and a word document (4 pages total) so you can print it right away or edit it as you please.Page 1: The Do-Now will have students make a prediction about the relationship between someone's shoe size and height. Then, they will color and cut out one of the shoe
Subjects:
Grades:
7th - 9th
Types:
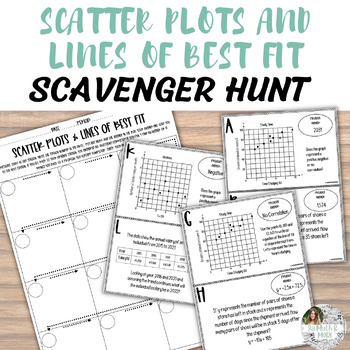
Scatter Plots & Lines of Best Fit | Slope Intercept Form | Scavenger Hunt
Students will be up and moving to navigate through this series of Self Checking Scavenger Hunt Questions. Students will practice Writing Lines of Best Fit through Tables, Graphs and Descriptions. But beware, the hunt is tricky, and they will need to be quick on their feet to avoid the pitfalls of incorrect answers!This activity is Self-Checking. As students move through the scavenger hunt, their answers will lead them to the next problem to solve and if they make a mistake, they will get looped
Subjects:
Grades:
7th - 10th
Types:
Tongue Twisters
Looking for a fun way for students to gather data? Then, try this tongue twister activity! Students work in a group and time each other saying different length tongue twisters 10 times each. Once they have the data collected, they can use Google Sheets (step-by-step directions provided) to make a scatterplot and insert a trend line. They can then use the line or equation to make a prediction about how long it should take them to say a longer tongue twister 10 times. Finally, they will test
Subjects:
Grades:
5th - 12th
Types:
CCSS:
Bivariate Data Analysis Project
First and most importantly this project is easily applicable to different data sets!!!!
I created this project to look at real data that hit home to students. We explored variables that they chose. We decided to analyze the relationship between scholar dollars and GPA (I have included a second relation as well).
Scholar dollars are like merits and demerits. At my school it was a system created as a way for students to track behavior and progress. Student would earn or lose these dollars base
Subjects:
Grades:
7th - 9th
Types:

Distance Learning Math: Data Management Resource Package
The follow group of videos include such lessons as two variable data sets (scatterplots), histograms, calculating averages, and how graphs can misrepresent data. There are a variety of assignments and assessment rubrics included with these instructional videos.
Subjects:
Grades:
7th - 9th
Types:
1:44
What happens during an internet minute: a data management activity
The following video shows 6 different infographics from 2015-2020. Each infographic looks at some of the numbers behind the most popular apps and services on the internet. Students get to connect with their own experience, predict trends, and see if there is a relationship with some of the data be constructing a scatter plot using two variables. A rubric for teachers is attached.
Subjects:
Grades:
7th - 9th
Types:
Also included in: Distance Learning Math: Data Management Resource Package
Showing 1-6 of 6 results

