5 results
Graphing Common Core RST.9-10.3 resources
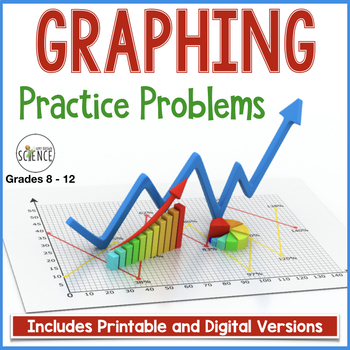
Graphing Practice Activity - Science Line Graphs, Data Analysis and Graphing
Graphing is a fundamental "must-have" skill in a science class. These practice problems will provide your students with a solid foundation and/or review of the basics of constructing line graphs. Further, students will practice analyzing data and using graphs to make predictions. If applicable to your teaching situation, you can have students complete their work in a digital Google Apps format. What is included in this resource?Editable and Printable 3-page student handoutPaperless Digital Vers
Grades:
8th - 12th
CCSS:
Also included in: Science Skills Bundle: Metrics, Measurement, Scientific Method, Graphing
Scientific Method Worksheets with Experimental Design Data Analysis and Graphing
SAVE 25% OFF LIST PRICES! Build foundational SCIENCE SKILLS such as experiment design, graphing, and data analysis! This bundle includes 8 worksheets that give your students structured support to practice these skills. Use in a scientific method unit, throughout the school year to reinforce skills, or as emergency sub plans. Each worksheet is a stand-alone lesson, so this set of resources can be used at the same time or completely independently of each other.Please click VIEW PREVIEW (above)
Subjects:
Grades:
7th - 10th
CCSS:
NGSS:
MS-LS2-1
, HS-LS2-1
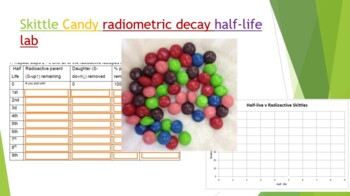
Skittle Radiometric Decay Half-life Lab
Did you know you can use Skittles candy to demonstrate absolute dating and radiometric decay! Buy a 1-4 lb bag at your local bulk warehouse store for savings. This lab is a great way to show how isotopes decay by shaking a plate full of random skittles. Students use Skittles to observe "Isotopes" decay over each half life. At the end of the lab (and only IF they have done all their work) they can enjoy their "daughter products". Skittles were used because they are durable, hypoallergenic, and th
Subjects:
Grades:
8th - 12th, Higher Education, Adult Education
Types:
NGSS:
HS-PS1-8
, HS-PS1-1
, HS-PS1-4
, HS-PS1-6
, MS-PS1-4
...
Also included in: Hands-on Science Semester Labs Bundle
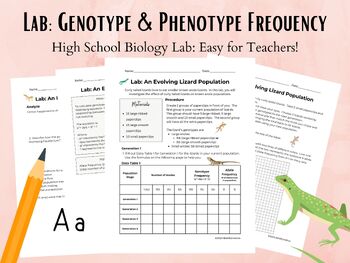
Lab: Genotype and Phenotype Frequency in Lizard Populations
This is a High School Biology lab where students will model changes in a populations traits. They will calculate genotype and phenotype frequency and monitor its changes over the course of 4 generations of lizards. Students will use A data table2 line graphthe Hardy Weinberg formula for genotype frequency Answer analysis questions. Teacher setup is minimal. Supplies are inexpensive and easily found in schools or at an office supply store. NGSS Standard CoveredLS3: Heredity: Inheritance and Var
Grades:
9th - 12th, Higher Education
Types:
CCSS:
NGSS:
HS-LS3-3
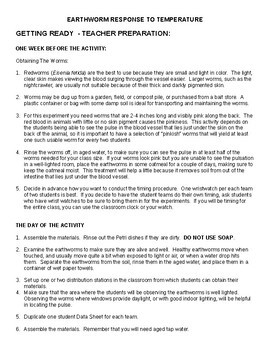
Earthworms Response to Temperature
This is a lab for Middle School and High School Science classes. It uses Red Wigglers, Eisenia fetida, to manipulate temperature variables to affect the worm's pulse rate. Red Wigglers are easy to work with and allow students to see the blow flow through the closed circulatory system and calculate the pulse rate of the worm. This lab uses graphing and data collection to help students understand how science accumulates data to make inferences about how conditions affect animals.
Showing 1-5 of 5 results


