766 results
6th grade statistics resources for Microsoft Word
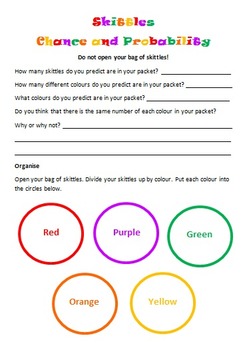
Skittles Chance and Probability (Editable)
Chance and Probability activity using yummy Skittles!!!
Students are to predict the colours and quantities before they open the skittles bag. Students are to complete a chance experiment where they use a tally to collect their data. Students then transfer their data in fractions, decimals and percentages. Students are to create a bar graph using their data as well as answer chance and probability questions about the data. I used this with my grade 5/6 students and they loved it!
Subjects:
Grades:
3rd - 10th
Types:
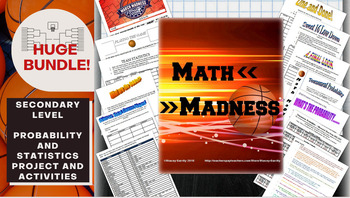
Math March Madness Full Tournament Project {BUNDLE}
Harness the excitement of NCAA March Madness with this huge project for secondary math teachers that follows all stages of the tournament! This Common Core aligned bundle comes with bonus parts not sold individually in my store so you can create a rich immersion in the tournament, practice probability and statistics and learn some interesting new ones along the way! Save $3 plus get bonus content by bundling!You can pick and choose which parts you would like to incorporate, or follow my schedu
Subjects:
Grades:
6th - 12th, Higher Education
Types:
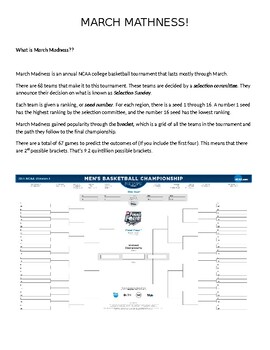
2024 March Mathness Madness NCAA Basketball Probability and Statistics Lesson
Every year I get my students excited about the NCAA Men's Basketball March Madness Tournament. I see articles written year after year from statisticians, sports journalist, celebrities, etc. about predicting the perfect bracket. Regardless that most have accepted it is nearly impossible, it has not deterred these enthusiast from finding an algorithm or a machine that can predict the outcomes.This packet guides students through 1) An explanation of what March Madness is all about2) A reading abou
Subjects:
Grades:
4th - 12th
Types:

Candy Probability: Discovery of EXPERIMENTAL vs. THEORETICAL Probability
Middle Schoolers LOVE probability!
This is a GREAT lesson around Halloween when the kids are already hyped up on sugar and want to 'talk' to their classmates.
This activity allows the students to DISCOVER the differences between EXPERIMENTAL and THEORETICAL probability and connect it to everyday experiences. The probability lesson lends itself to fractions, decimals, percents, data collection, rational & irrational numbers, statistical graphs (box and whiskers, frequency tables...), measu
Subjects:
Grades:
5th - 9th
Types:
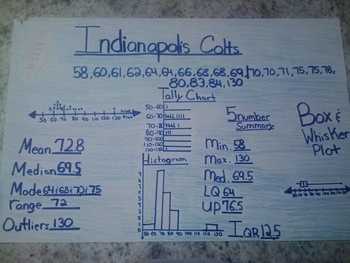
Favorite Sports Team: Data Displays and Measures of Central Tendency Project
Students will create a poster using sports statistics. Depending on the time of year, you may want to use football scores, basketball scores, data from the Olympics, etc. Students will use the internet (or you can print out statistics for them) to find sports data.
The students really buy into this project because it is about something they are interested in - their favorite sports team!
Students will display their knowledge of several data displays: line plot, tally chart, histogram and bo
Subjects:
Grades:
5th - 8th
Types:
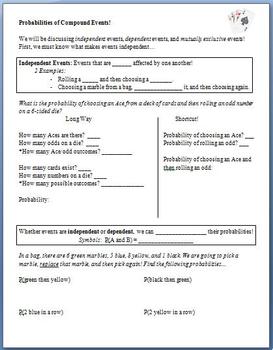
Probability of Compound Events (Guided Notes)
This lesson is meant to be used as guided notes for a whole class.
Students begin by learning what makes 2 events independent. After slowly working through a problem about rolling a die and choosing a card, they discover that they can multiply probabilities when working with these compound events. They then attempt problems involving picking marbles from a bag. Next, they learn about dependent events, and finally, mutually exclusive events.
The last 2 pages are a copy of the key.
Subjects:
Grades:
6th - 12th
Types:
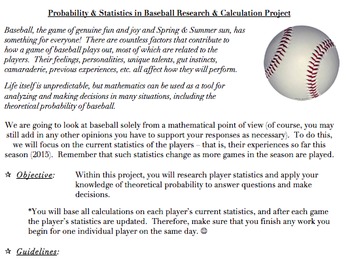
Probability & Statistics in Baseball Project (Common Core Aligned, AND FUN!)
The problems and activities within this document are designed to assist students in achieving the following standards: 6.SP.B.5, 7.SP.C, HSS.CP.A.2, HSS.CP.A.3, HSS.CP.B.7, HSS.CP.B.9, as well as the standards for mathematics practice and the literacy standards. They are also designed to help the teacher assess the students’ abilities when it comes to working with the ideas within the standards.This document contains the following:A project designed to allow students to investigate theoretical
Subjects:
Grades:
5th - 12th, Higher Education, Adult Education, Staff
Create a Line Plot Project
Looking to assess line plots? Look no further!This project incorporates learning targets, skills, collaboration, and technology.Directions: With a partner, create a question used to collect data from your classmates. (Examples: In inches, how long is your hand? In cm, what is the circumference of your head? etc.) Then, create a line plot with your results. Use fraction intervals.Requirements:Create a reasonable question (Teacher approval required)Collect at least 20 pieces of dataCreate a line p
Subjects:
Grades:
4th - 6th
Types:
CCSS:
Also included in: Upper Grade Math Projects
NCAA March Madness Basketball Tournament Team Research Statistics
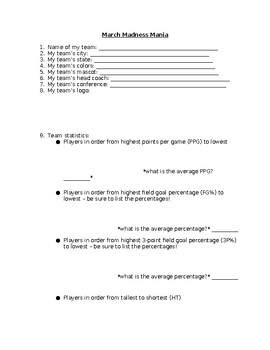
Do you have students interested in the March Madness basketball tournament? Then this is the activity you need!To begin our March Madness unit, we look at all of the teams participating in the tournament and complete a map together to show where each team is from. We notice that some states have more than others and some states have none, and spend time discussing why that might be. Students will complete their own March Madness bracket.Students will then select a team in the NCAA March Madness
Grades:
4th - 9th
Types:
Probability ~ Making Predictions
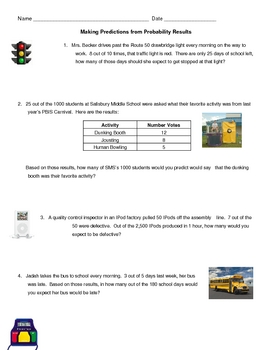
On this two page worksheet plus answer key, students are asked to use the results of either a survey or experiment to make predictions. Students could use percents or proportions in order to solve these real world problems. Please see demo for types of problems.
Subjects:
Grades:
6th - 8th
Types:

Safe Cracker - Mean, Median, Mode, & Outliers - Math Fun!
Do your students get excited when you tell them it's time to study outliers and measures of center? Of course they don't.
But they will if you use this fun, Safe Cracker worksheet!
Students can become world famous safe crackers! Your students will use the clues and their math skills to help crack the safes, in order to claim the prizes found inside.
Students are given three "clues", which involve outliers and measures of center (mean, median, and mode). The answers become the numbers in the
Subjects:
Grades:
5th - 8th
Types:
CCSS:
Outliers Clusters Gaps Worksheets (Two Worksheets)
Included are 2 worksheets in which students look at dot plots and line plots in order to find outliers, clusters and gaps. Also included are teacher answer sheets.
**This activity is included in a larger bundle (see link below)
https://www.teacherspayteachers.com/Product/Statistics-Unit-3505315
Subjects:
Grades:
5th - 7th
Types:
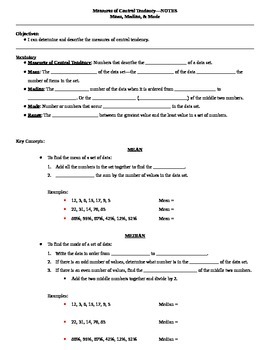
Measures of Central Tendency Guided Notes
These are guided notes for a lesson on measures of central tendency including mean, median, mode, and range. There are several examples in the notes and the same data sets are used to show each measure of central tendency.I have also included a teacher key to show you what to fill in the blanks as your students follow along.To use these notes, I simply projected them onto my whiteboard, gave the students their blank copies, and had them follow along and write what I wrote. This works great when
Subjects:
Grades:
5th - 12th
CCSS:
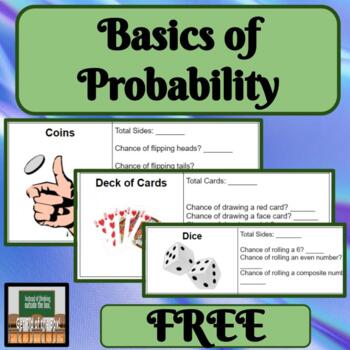
Basics of Probability Dice Cards Coins
About this Resource:Many students do not know all that is needed about dice, coins, and decks of cards. In order to be successful, it is important to cover all of this information first. Topic Covered:*Probability Ways to use this product in your classroom:-whole class-exploration-hands-on-small group-independent Other products with similar content.M&M's ProbabilityBox Plots with WeatherVisuals with Measures of Central TendencyCreating Line Plots
Subjects:
Grades:
6th - 9th
Types:
Also included in: Probability Bundle Hands On Dice Cards Coins Simple Probability
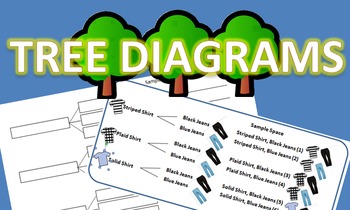
Tree Diagrams Notes and Practice Packet
I created this packet on tree diagrams for my probability unit so that students could work with one another to learn how to create a tree diagram on their own without my direct instruction. This gave me the freedom to help students that needed more individualized instruction and guidance. This packet was great to use before introducing the fundamental counting principle.
Subjects:
Grades:
4th - 9th
Types:
My Lego House
This is a 2-3 week maths project for anyone from Grade 3-6. Done in pairs or small groups the project entails students designing and building their own Lego house. In the project students will cover a range of maths concepts including area, perimeter, counting, money, graphing and interpreting data. The project includes a detailed teacher booklet with photographs of student's work and examples for each of the lessons. The student book is also included for students to work from, although we found
Subjects:
Grades:
3rd - 6th
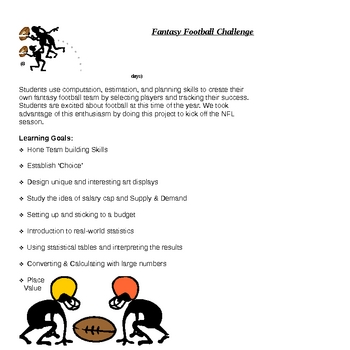
Are You Ready for Some FOOTBALL? (Middle School MATH Project)
Are you looking for a unique way to engage your students in authentic math concepts using real-world data that will blow their socks off? If so, this is your project! I have used this with eighth graders, but it would work well with any middle school performance indicators. This project involves so many performance indicators - estimation, rational numbers, scientific notation, number & word forms, budgeting, graphs, statistics, integers, media, cooperative learning, research, technology, vi
Subjects:
Grades:
5th - 8th
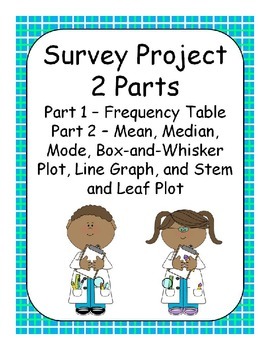
Survey Project - Frequency table, Mean, Median, Mode, and Various Plots
This project is a 2 part project about different ways to display data.
In part 1, Students will create a question with 4-6 possible answer choices. After surveying 50 different people, students will create a frequency table displaying their data. There are questions for students to answer about the survey and the people they’ve surveyed.
In part 2, students will create a question that will trigger an answer that is a number. After surveying 25 different people, students will find the mean,
Subjects:
Grades:
5th - 7th
Types:
CCSS:
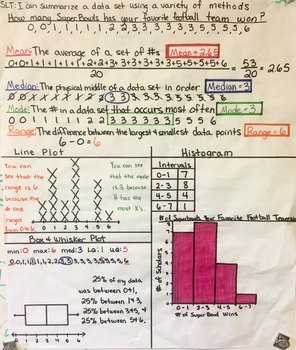
Statistics Project Line Plot Histogram Box & Whisker Measures Central Tendency
Your purchase comes with the rubric and checklist pictured above, I had scholars get their checklist signed after each part, when all signatures were collected they were given their poster paper. This project allows scholars to come up with their own statistical question, collect data from their peers, and then prepare a poster to summarize their data. The poster includes the data set, measures of central tendency (mean, median, mode, & range), line plots, histograms, box & whisker plots
Subjects:
Grades:
6th - 7th
Types:
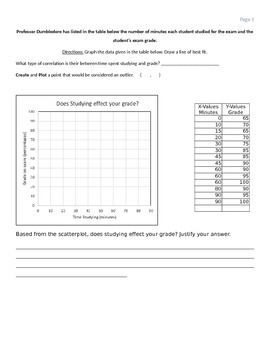
Scatter plot worksheet (Positive Correlation)
In this worksheet, the students are given a scenario and table of data points. The students must plot the points, draw a line of best fit, create & plot a possible outlier data point. Also, there is a short writing portion where students must reflect and write about the scatter plot scenario.
Subjects:
Grades:
6th - 9th
Types:
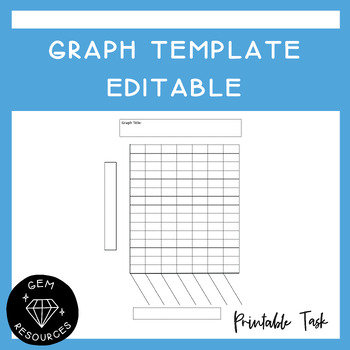
Graph Template Data and Statistics Maths Histogram Bar Column Drawing Editable
Students can use this to help them draw up a graph. It allows them to be accurate and has boxes for the titles needed for the graph.This Word document is editable.
Subjects:
Grades:
2nd - 6th
Types:
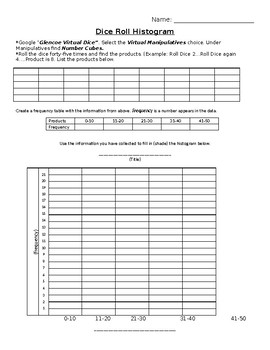
Dice Roll Histogram - Online Interactive Activity Frequency Table & Historgram
Students will complete a frequency table and histogram that corresponds to data collected through the use of rolling two dice (Statistics Lesson). To get the data for this frequency table, students will roll two dice and multiple the numbers rolled together. The product of these two rolls will be the data point. Students will write down each product, rolling their dice a total of 45 times. Students will then fill in the frequency table and graph on a histogram. We used an online dice. This helps
Subjects:
Grades:
5th - 8th
Types:

Theoretical vs Experimental Probability using Skittles
Students will work in pairs or groups. First they will find and use theoretical probability from a bag of skittles. Then students will find the experimental probability for each color and compare that with the theoretical probability.
Activity is in WORD so you can change things to put your own personal touches!!! I have done this activity SEVERAL TIMES and STUDENTS LOVE IT!! Great way to get students engaged in finding compound probabilities. Each group will get different answers since each
Subjects:
Grades:
5th - 12th
Types:
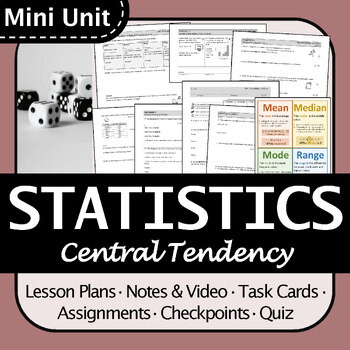
BC Math 8 Measures of Central Tendency Mini Unit, Engaging, Differentiated
This is an engaging mini unit that would work great for an in-depth look at measures of central tendency (mean, median, mode, and range) and how to choose them. The resources are well-organized and differentiated so they are accessible to a wide range of students.Students learn:How to calculate mean, median, mode, and range from a data set or frequency table.How to choose the best measure of central tendency (mean, median, or mode) given a particular situation or data set. Includes:Detailed les
Subjects:
Grades:
6th - 9th
Types:
Showing 1-24 of 766 results


