51 results
7th grade statistics resources for SMART Notebook
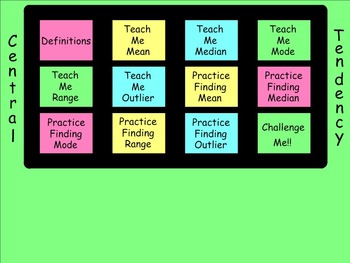
How I Teach Finding Mean, Median, Mode, Range, and Outliers
This is a 70 page Smartboard file covering Central Tendency. The students are given definitions for Mean, Median, Mode, Range, and Outlier. They are also taught how to find each when given a list of numbers. There are plenty of practice pages for each and all include answers. There is also a section of more challenging problems at the end. All pages are linked to a central homepage so that no matter where you are in the file it will always be easy to navigate around.
Subjects:
Grades:
6th - 9th
Types:
Mean, Median, Mode, Range Smartboard Slides Lesson Measures of Central Tendency
You'll LOVE this great Data Measures-of-Central-Tendency: Mean, Median, Mode, & Range Smartboard-Slides-Lesson. Your students will LOVE this interactive smartboard lesson that teaches and practices Mean, Median, Mode, and Range, along with a Card Game for practice. YOU GET 28 slides total, a very comprehensive and complete lesson. You'll enjoy using this great smartboard lesson year after year. WARNING: You MUST have SMART Technologies SMART software, and a SMARTBOARD to teach from, to effec
Subjects:
Grades:
4th - 7th
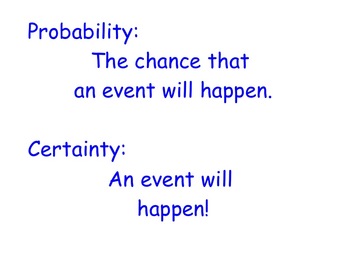
7th Grade CCSS Probability Unit Lessons
Complete 7th Grade CCSS Probability Unit Lessons.
This download includes all the lessons for the 7th grade probability unit and homework for each lesson. The entire lesson progression can be accessed for free on my site.
These lessons can be used independently or with video lessons that are available on my site. The video lessons are exceptionally useful with students that have been absent or are more advanced and need an independent study unit.
Subjects:
Grades:
6th - 8th
Box and Whisker Plots Smartboard Slides Lesson Step by Step How to Constuct
Math Teachers ~ You'll LOVE this GREAT Smartboard-Slides-LESSON that teaches students step-by-step how to construct a Box-and-Whisker-Plot; Least/Greatest Value, Lower/Upper Quartile, Median, and how to Find the Interquartile and Range. 37 slides in all! Your students will LOVE this smartboard lesson. WARNING: You MUST have SMART Technologies SMART software, and a SMARTBOARD to teach from, to effectively download, open and use this Interactive Smartboard Lesson. Go to https://legacy.smarttech.co
Subjects:
Grades:
5th - 8th, Staff
Also included in: Box & Whisker Plots Smartboard Slides Notes Worksheet BUNDLE
Dot Plots and Data Distribution Displays Smartboard Slides Lesson
Dot-Plots and Data-Distribution Smartboard-Slides-Lesson covers Data-Distribution and Creating Dot-Plots. Lots of practice problems provided. You'll love using this Smartboard Lesson to teach from year after year! WARNING: You MUST have SMART Technologies SMART software, and a SMARTBOARD to teach from, to effectively download, open and use this Interactive Smartboard Lesson. Go to https://legacy.smarttech.com/en/products/education-software/smart-learning-suite/download/trial to download a free t
Subjects:
Grades:
4th - 7th, Staff
Box and Whisker Plots Smartboard Slides Lesson St. Patrick's Day Theme
This Box and Whisker Plots Smartboard Lesson teaches students how to create a Box Plot step by step. LOTS of practice in creating and reading Box and Whisker Plots, along with an Interactive QUIZ on Box Plots. These slides have a St. Patrick's Day clipart theme. In case you don't want that, I also have the SAME Box and Whisker Plots Smartboard Lesson on everyday math slides as well. https://www.teacherspayteachers.com/Product/Box-and-Whisker-Plots-Smartboard-Lesson-Step-by-Step-How-to-Constuct-
Subjects:
Grades:
5th - 7th
Categorical Data Smartboard Slides Lesson Displaying Analyzing Organizing
Categorical-Data Math Smartboard-Slides-Lesson covers the TEKS for 6th grade Math specific to this skill. Lots of great examples and teaching, along with interactive practice for your students. You'll LOVE this resource and use it year after year! WARNING: You MUST have SMART Technologies SMART software, and a SMARTBOARD to teach from, to effectively download, open and use this Interactive Smartboard Lesson. Go to https://legacy.smarttech.com/en/products/education-software/smart-learning-suite/
Subjects:
Grades:
5th - 8th
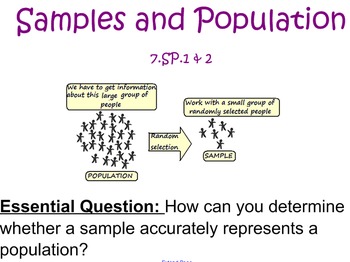
Samples and Population
Notes and practice problems to tell the difference of samples and population, biased and unbiased and if data collected is valid.
Subjects:
Grades:
6th - 8th
Types:
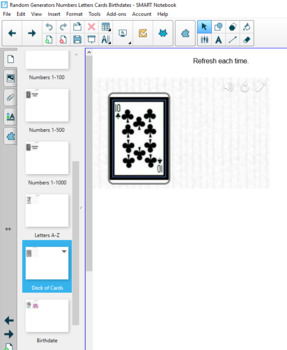
Random Number Letter Deck of Cards Birthday Generator SMART 18 Flash Replacement
If your district has upgraded to Windows 10 and SMART 18, then many of your highly-used flash components will no longer work. I have been recreating them in the new SMART 18. These Random Generators (Numbers 1-36, Numbers 1-100, Numbers 1-500, Numbers 1-1000, Letters A-Z, Playing Card from a Deck of Cards, & Birthdate) are comparable to what was previously available in SMART, though they operate differently.Random Generators SMART 18 Flash Replacement by Brian Tillmann is licensed under a Cr
Subjects:
Grades:
K - 12th, Staff
Types:
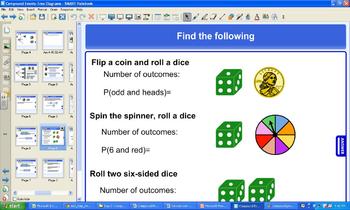
7th Grade Common Core Compound Probability
Students learn about independent and dependent probability through this lesson that uses lists, tree diagrams, etc. There is an notes page and assignment to accompany (under same title)
Subjects:
Grades:
7th - 8th
Median Mode Range Smartboard Slides Lesson Measures of Central Tendency
Incredible ~ 31 slides ~ Smartboard-Slides-Math-Lesson over Median, Mode, and Range (Measures of Central Tendency). This is EVERYTHING you need to teach these three measure-of-central-tendencies. Students will enjoy the interactive slides where they work problems at the Smartboard. Please be sure to see my other smartboard lesson on Finding the Mean, Average. You'll enjoy using this resource year after year. WARNING: You MUST have SMART Technologies SMART software, and a SMARTBOARD to teach from
Subjects:
Grades:
4th - 7th, Staff
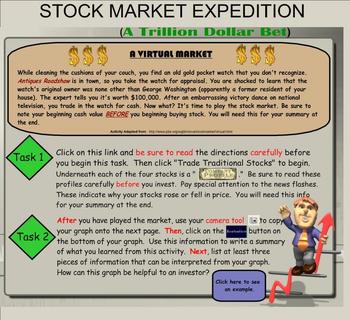
Stock Market Expedition
6th Grade Math CCSS and NETS aligned and addresses the following I Can Statements: (1) I can read and interpret information from a graph/table and compare quantities. (2) I can collect and organize data to answer a question, make statements and draw conclusions based on data. (3) I can use data to predict future economic trends based on past and present information.
This is the First (Introductory) Lesson in a Stock Market activity I use in my classroom. Through this inquiry-based activity
Subjects:
Grades:
6th - 8th
Types:

Stock Market Challenge
This is the second lesson in a Stock Market activity that I do in my class each year. It is CCSS aligned for 6th grade math and NETS aligned and is intended to be used in conjunction with my Stock Market Expedition activity.
Student teams will trade stocks and track the progress of their Stock Market Simulation portfolio by using spreadsheet software and the Internet. They will relate the information to current events and the economy. The Internet will be used to research and identify stock
Grades:
6th - 8th
Types:
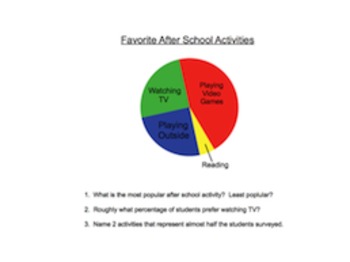
Exploring Graphs and Charts
This is a great introductory lesson on different ways of displaying data and how to interpret data. Explore Pie Charts/Circle Graphs, Bar Graphs, Line Graphs, and Pictographs. Each has an explanation and sample graph with questions to check for students' ability to interpret data. This lesson uses lots of bold colors and pictures that are sure to grab your students' attention!
Subjects:
Grades:
5th - 7th
Virginia SOL Review TEIs Math Grade 7 (2009 SOLs)
Virginia SOL Review TEIs Math Grade 7
Technology Enhanced Items
Subjects:
Grades:
5th - 7th
Types:

Using Models to Represent Ratios and Rates! SmartBoard Lesson / Scaffold Notes
In this SmartBoard lesson, students will learn how number lines, charts, tables and graphs can be used to represent unit rates, rates and ratios. Students will be given examples of how ratios are placed in tables/charts to see relationships and solve for unknowns. Students will see how double number lines are also used to represent rates and ratios. Lastly, students will see how line graphs, using x and y along with points can represent ratios and rates. There are examples of each for the class
Subjects:
Grades:
5th - 7th
SMARTBOARD lesson on ratios, fractions, percentages, and more
This smartboard lesson showcases how ratios, fractions, decimals, probabilities, and percentages are all similar ways of looking at the same thing. Each page has a spinner with a different amount of colored slices on it. As you go from many slices to fewer slices, the chance of correctly predicting what color comes up gets much better.
Have students 'bet' classroom rewards like tickets or candy to see who can correctly guess the most colors as you go through the lesson.
Subjects:
Grades:
3rd - 12th, Adult Education

Smart Board Probability Game
This is a great interactive game to practice probability with your students. Students are given twenty bingo chips to start and decide throughout the game whether or not they want to try to beat the odds and win a game! Each game costs chips to play, but the pay out is big. Kids love this game!!
Subjects:
Grades:
6th - 8th
Types:

Measure of Central Tendency- Mean, Median, Mode, and Range (SmartBoard)
Thank you for viewing my products!
This is a 13 slide SmartBoard for measures of central tendency (mean, median, mode, and range). I used it for grade 4, but really it could be adapted to fit many grades (3-7). I noticed the current Common Core Standards have measures of central tendency in 6th grade and 7th grade. This could be a good introduction to 6.SP.5 or 7.SP.4. The lesson includes an anticipatory set, rationale, direct instruction (with vocabulary), guided practice, checks for understan
Subjects:
Grades:
3rd - 7th
Types:
Data Analysis & Probability: Memory Match Game - NOTEBOOK Gr. 6-8
**THIS is a SMART Notebook Version**This is a Memory Match Game Mini. It is just one activity from the full lesson plan Data Analysis & Probability - NOTEBOOK Gr. 6-8.About this Resource: In this Memory Match Game mini, 10 matching pairs of data analysis and probability questions are hidden in the puzzle. This mini is great for comprehending the data analysis and probability concepts covered in the Five Strands of Math for grades 6-8.**********************************************************
Subjects:
Grades:
6th - 8th
Types:
Data Analysis & Probability: Spinner Game - NOTEBOOK Gr. 6-8
**THIS is a SMART Notebook Version**
This is a Spinner Game Mini. It is just one activity from the full lesson plan Data Analysis & Probability - NOTEBOOK Gr. 6-8.
About this Resource:
In this Spinner Game mini, 15 data analysis and probability questions are provided on the wheel. This mini is great for comprehending the data analysis and probability concepts covered in the Five Strands of Math for grades 6-8.
************************************************************************
View
Subjects:
Grades:
6th - 8th
Types:
Data Analysis & Probability: Board Game - NOTEBOOK Gr. 6-8
**THIS is a SMART Notebook Version**
This is a Board Game Mini. It is just one activity from the full lesson plan Data Analysis & Probability - NOTEBOOK Gr. 6-8.
About this Resource:
In this Board Game mini, 16 data analysis and probability questions are split between two teams in the form of multiple choice questions. This mini is great for comprehending the data analysis and probability concepts covered in the Five Strands of Math for grades 6-8.
**********************************
Subjects:
Grades:
6th - 8th
Types:
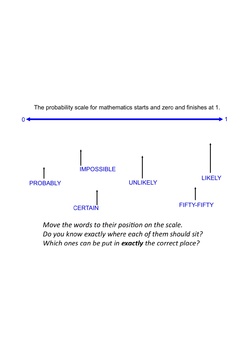
Introduction to Probability: Smartboard Lesson
This lesson focuses on the difference between everyday language and the specific value of various probabilities. The lesson starts with a game that my students absolutely love. We play several rounds of the game, changing the rules as we go to explore some inherent concepts of basic probability. There are a couple of slides where students have the opportunity to come to the board and move the words around. This can lead to some important discussions about the use of the given vocabulary. The
Subjects:
Grades:
5th - 9th
Types:
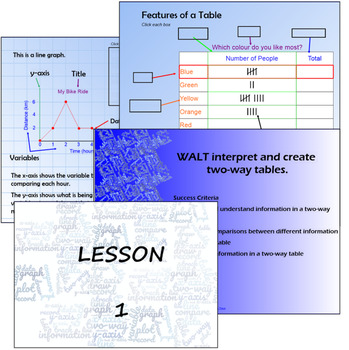
Data Lesson Sequence - 4 Lessons - Data/Statistics - KS2/Stage 3
Data lessons on tables, two-way tables and line graphs presented in Smart Notebook. It includes 4 lesson presentations including WALTs and Success Criteria in the slides, all ready to be used with your class. It gives some basics for a unit of work on data and it is fully editable. The aim of these lessons is to break down each data collection/displaying method into simple language so that it is easy to follow.Lesson 1 - Simple Data Tables. This goes through the features of a table and practice
Subjects:
Grades:
4th - 7th
Showing 1-24 of 51 results


