155 results
Not grade specific statistics pdfs

Teacherpreneur Data Insights - TPT Seller Business Tracker Analysis Spreadsheets
Welcome to Teacherpreneur Data Insights – a business data tracker designed to elevate your teacher seller journey. Gain actionable insights, track trends, and optimize your strategies with this comprehensive tool. In a world where data is powerful, this guidebook and Google Sheets combo empowers you to navigate your TPT store effectively. Seamlessly analyze your metrics, make informed decisions, and propel your store to new heights. Utilize this powerful tool to identify your best-selling produc
Subjects:
Grades:
Not Grade Specific
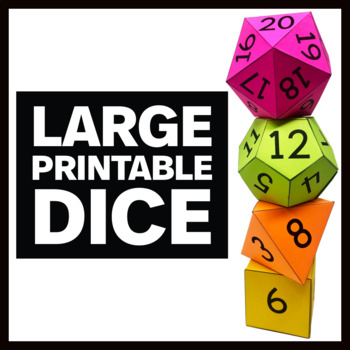
Printable Dice Templates - Blank Die Templates - 6, 8, 12, and 20 sided
This is a set of four printable dice templates. Each template comes with a numbered and a blank version. 6 sided 8 sided 12 sided 20 sided This resource is easy to use! Print out the 3D shape you want to assemble, cut out the net of the polyhedron, fold on the lines, and glue the flaps to the corresponding side.You can also use the blank shapes in your geometry or math class if you want to construct a 3D cube, octahedron, dodecahedron, or icosahedron.
Subjects:
Grades:
Not Grade Specific
Types:
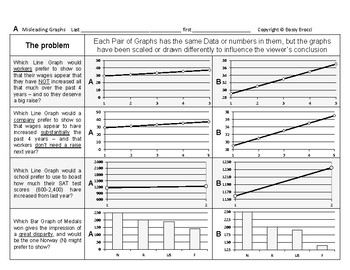
Stats&Data 14: Misleading & Misinterpreting Data Graphs Charts Statistics
This is an excerpt from my popular line ofBossy Brocci Math & Big Science workbooks on Amazon.ANSWER KEY included=======================Students will:1) Analyze 20 different Graphs or Data Displays2) Draw Conclusions & Answer questions about theaccuracy, fairness, limitations & legitimacy of those Graphs3) Answer 16 Multiple-choice questionsbased on their Calculations & Observations4) Be compelled to show their work in a neat & orderly format5) Be trained to methodically &
Subjects:
Grades:
Not Grade Specific
Types:
FTCE General Knowledge Exam Test Prep Math
This is an original and growing; FTCE General Knowledge Exam Math Test Prep Pack. Word problems; Distance, slope, Statistics - Probability Percentages - Unit GeometryScale and ratioAdditional percentages, probability, scale and ratio material added. Here’s what teachers just like you are saying about this resource:⭐️⭐️⭐️⭐️⭐️ Kristie N. says, "I found this very helpful! Thank you...." ⭐️⭐️⭐️⭐️⭐️Recebba G. says, "Thank you for putting this together!" ⭐️⭐️⭐️⭐️⭐️Halley U. says, "There are GK math t
Subjects:
Grades:
Not Grade Specific
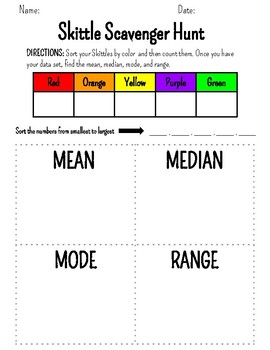
Mean, Median, Mode, and Range Skittle Activity
Have students practice mean, median, mode, and range using Skittles!
Subjects:
Grades:
Not Grade Specific
Types:
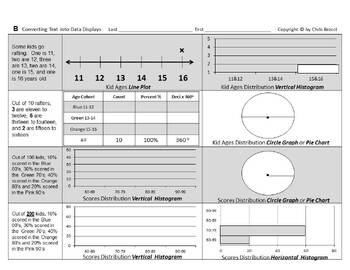
Stats&Data Bundle C: Data Displays Measures of Central Tendency & Variation
From the Author of Bossy BrocciMath & Big Science workbooks on Amazon,this Bundle of Data Displays,Measures of Central Tendency(Mean, Median, Mode & Range);and Measures of Variation(Quartiles, Interquartile Range, Outliers & Box Whisker plots)contains:11 Lessons32 Worksheets832 Problems & Tasks- and Assessment up the a$$=======================Answer KEYS included=======================Coverage Specifics:#1 Identify & Select Common Typesof Data DisplaysStudents will:1) Identi
Subjects:
Grades:
Not Grade Specific
Types:
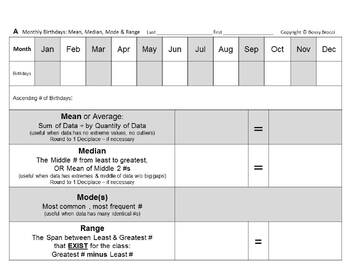
Stats&Data Bundle B: Birthdays Data Displays Variation Mean Median Mode Range
From the Author of Bossy BrocciMath & Big Science workbooks on Amazon,this Birthdays Stats (Mean, Median, Mode, Range),Measures of Variation & Data Displays Bundlecontains:2 Lessons12 Worksheets294 Problems & Tasks- and Assessment up the a$$=======================Answer KEY included=======================Coverage Specifics:#1 Author's Numbers Birthdays ProjectStudents will:1) Convert the given Monthly Birthdaysfrom Mr. Brocci's School numbers into:Ascending List/Data SetMeanMedianMod
Subjects:
Grades:
Not Grade Specific
Types:
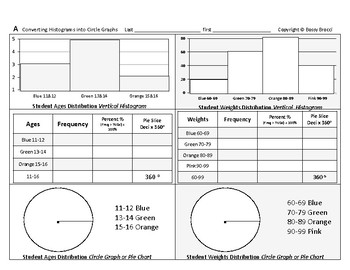
Stats&Data 03: Convert Histograms into Circle Graphs Construct Create Pie Charts
This is an excerpt from my popular line ofBossy Brocci Math & Big Science workbooks on Amazon.Answer KEY included=======================Students will:1) Convert 3 Vertical Histograms into3 Data Tablesand3 Colored or Shaded Circle Graphs (Pie Charts)2) Convert 1 Horizontal Histogram into1 Data Tableand1 Colored or Shaded Circle Graph (Pie Chart)3) Be compelled to show their work in a neat & orderly format4) Be trained to methodically & systematicallyPresent Data in different DisplaysN
Subjects:
Grades:
Not Grade Specific
Types:
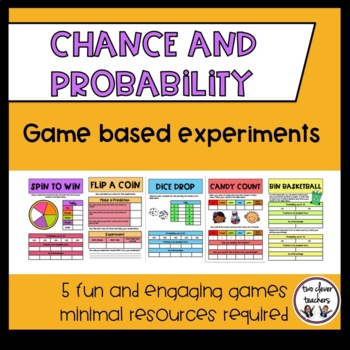
Chance and Probability l Game Based Experiments
5 Fun and engaging Differentiated Chance and Probability Games•Flip a Coin•Spin and Win•Dice Drop•Candy Count (Two Versions: Game 1 – M&M’s, Game 2 – Skittles)•Bin BasketballThe games require simple resources that can be found in the classroom with exception of Candy Count. For that game you will need to purchase small party packs of M&Ms or Skittles, options for either candy are provided.Instructions:Math Groups - Use this as part of a math rotation. Each game has simple to follow instr
Subjects:
Grades:
Not Grade Specific
Types:
Also included in: Chance and Probability Game and Experiments Bundle
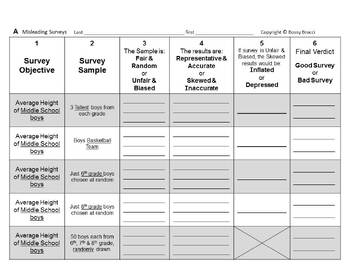
Stats&Data Bundle D: Misleading Misinterpreting Surveys Statistics Graphs Charts
From the Author of Bossy BrocciMath & Big Science workbooks on Amazon,this Bundle onMisleading & MisinterpretingSurveys, Statistics, and Graphs/Chartscontains:2 Lessons8 Worksheets78 Problems & Tasks- and Assessment up the a$$=======================Answer KEYS included=======================Coverage Specifics:#1 Misleading & Misinterpreting Surveys & Statistics+ QUIZStudents will:1) Read 10 different Surveys and Survey Samples2) Determine and Write if those Surveys are:Fair
Subjects:
Grades:
Not Grade Specific
Types:
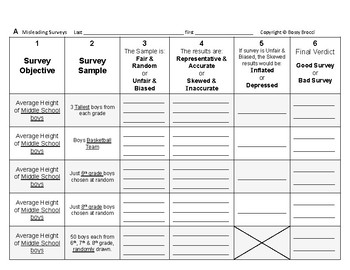
Stats&Data 13: Misleading & Misinterpreting Surveys & Statistics + QUIZ
This is an excerpt from my popular line ofBossy Brocci Math & Big Science workbooks on Amazon.ANSWER KEY included=======================Students will:1) Read 10 different Surveys and Survey Samples2) Determine and Write if those Surveys are:Fair & RandomUnfair & BiasedRepresentative & AccurateSkewed & InaccurateInflatedDepressedGood SurveyBad Survey3) Answer 24 Multiple-choice questionsbased on their Observations4) Analyze 5 Statistical Problems & Conclusions for accuracy
Subjects:
Grades:
Not Grade Specific
Types:
AFL Dice Football (Maths Game - no-prep)
Are your students highly engaged and interested when you are doing anything sport related?If so this is the game for you!A no-prep game - all you need is some dice and this gameboard!Math involved:MultiplicationAdditionProbability/strategyIt is a simple but brilliant, all encompassing game and we have found our students to be super engaged.Keep track of you games with our AFL Dice Football Statistics Sheet!**************************************************************Please check out our range o
Subjects:
Grades:
Not Grade Specific
Also included in: AFL Dice Football
Basketball Statistics
Reinforce introductory statistics with this interactive basketball activity. Students go in the gymnasium or outside and take 10 free-throw shots. The results of this activity are depicted in a frequency table. Then students are responsible for calculating the mean, median, mode and range of the set of frequency numbers. Additionally, students are challenged to use the information to create a dot plot and/or bar graph. Finally, there are 10 questions where students need to not only interpre
Subjects:
Grades:
Not Grade Specific
Types:
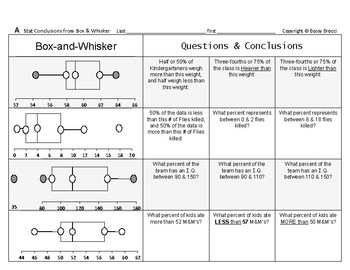
Stats&Data 09: Draw Statistical Conclusions from Box and Whisker Box Plots QUIZ
This is an excerpt from my popular line ofBossy Brocci Math & Big Science workbooks on Amazon.Answer KEY included=======================Students will:1) Analyze 8 Box & Whisker Plots (Box Plots)2) Answer at total of 24 questionsfrom those Plots regarding variousFraction & Percent Distribution portions3) Be compelled to show their work in a neat & orderly format4) Be trained to methodically & systematicallyTranslate or Convert Box & Whisker Plotsinto Fractions & Percen
Subjects:
Grades:
Not Grade Specific
Types:
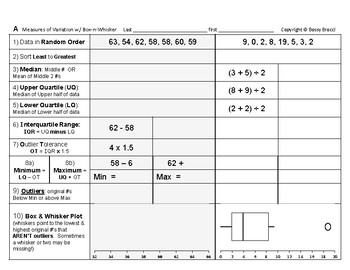
Stats&Data 06: Variation Quartiles Interquartile Range Outliers Box Whisker Plot
This is an excerpt from my popular line ofBossy Brocci Math & Big Science workbooks on Amazon.Answer KEY included=======================Students will:1) Sort or Sequence 8 different Data Sets or Sets of Numbers2) Calculate & Identify for each of the 8 Data Sets the:MedianUpper QuartileLower QuartileInterquartile RangeOutlier ToleranceAllowed MinimumAllowed Maximumandany Outliers3) Draw or Construct the Box and Whisker Plots (Box Plots)directly beneath their calculations4) Be compelled to
Subjects:
Grades:
Not Grade Specific
Types:
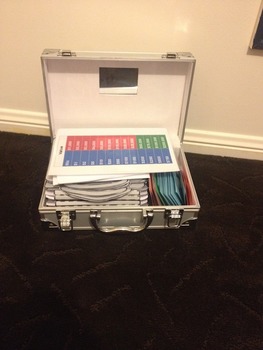
Deal or No Deal Probability Game
The package provides template to create the Deal or No Deal Probability game.
The package includes:
- Silver Briefcase printable templates
- Value Score card
- Deal or No Deal Rules sheet
- Bankers Probability Sheet
The briefcase templates can be cutout and numbered and in this case blue tack was used to keep the cases closed. The prices were laminated coloured pieces of paper with the prices written on them in permanent marker. The case itself is an old makeup case emptied out to carry the ga
Subjects:
Grades:
Not Grade Specific
Types:
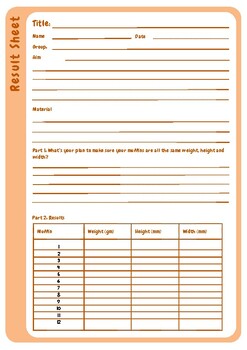
Consistency Confections: A Muffin-Baking Exploration in Product Quality
Embark on a delectable journey with 'Consistency Confections: A Muffin-Baking Exploration in Product Quality.' In this engaging activity, participants delve into the world of product consistency, a critical factor in commercial success. By immersing themselves in the art of muffin baking, participants work collaboratively in groups to select and implement methods ensuring uniform size and shape.Each group meticulously measures their muffins, and through thoughtful data analysis, participants eva
Subjects:
Grades:
Not Grade Specific
Types:
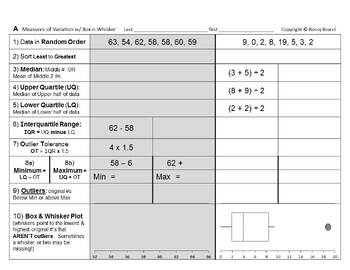
Stats&Data Bundle A: Box Whisker Box Plots & Measures of Variation bundle
Spun-off from my popular series of Bossy Brocci Math & Big Science Workbooks on Amazon,this Measures of Variation Box & WhiskerBox Plots Bundlecontains:4 Lessons10 Worksheets263 Problems & Tasks- and Assessment up the a$$=======================Answer KEYS included=======================Coverage Specifics:#1 From Quartiles Interquartile Range& Outliers to Box Whisker PlotsStudents will:1) Sort or Sequence 8 different Data Sets or Sets of Numbers2) Calculate & Identify for each
Subjects:
Grades:
Not Grade Specific
Types:
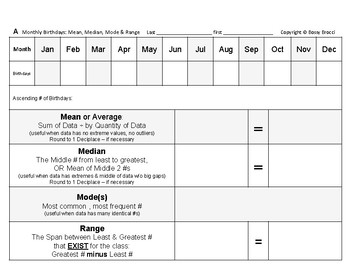
Stats&Data 11: YOUR Birthdays Variation Central Tendency Data Displays Project
This is an excerpt from my popular line ofBossy Brocci Math & Big Science workbooks on Amazon.=======================Students will:1) Convert a Monthly Birthdays tallyfrom YOUR School or Class(es)into:Ascending List/Data SetMeanMedianModeRangeUpper QuartileLower QuartileInterquartile RangeOutlier ToleranceAllowed MinimumAllowed MaximumOutliersBox & Whisker PlotVertical Bar GraphLine GraphStem & Leaf PlotLine Plot (X Plot)Data TableCircle Graph (Pie Chart)andVertical Histogram2) Be co
Subjects:
Grades:
Not Grade Specific
Types:
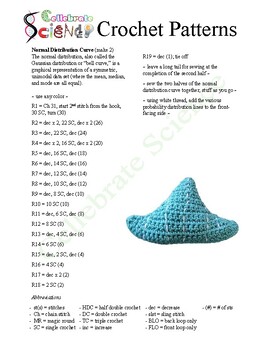
Standard Curve Crochet Pattern
Explore our crochet project showcasing a standard curve to offer students an interactive and captivating approach to learning about the standard distribution curve. Engage in a hands-on experience that will enhance understanding and retention of this important concept.
Subjects:
Grades:
Not Grade Specific
Types:
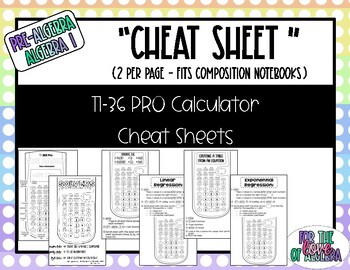
TI-36 PRO Scientific Calculator Cheat Sheets
These "cheat sheets" are half sheets of paper and fit into an interactive notebook. They are great visuals for kids when using the calculator for help with the following topics:The basic uses / functionsCreating a table from an equationSolving for xSolving systems of equationsSolving quadratic equationsLinear & Exponential Regressions (Line of Best Fit)Mean & MedianMax / MinQuartiles
Subjects:
Grades:
Not Grade Specific
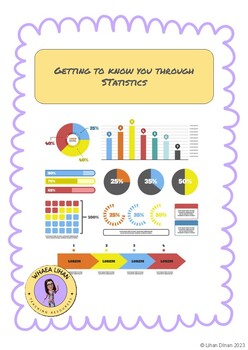
Getting to know you through statistics
Getting to know you through statistics, getting to know your students at the beginning of the teaching year can often resort to the tried and true activities. Why not try something new and find out more about your students likes/dislikes, interests, hobbies through learning. This resources supports you and your students to work through statistics, and working through the PPDAC cycle. It gives you options for making graphs as well as using digital platforms to create your graphs and show your dat
Subjects:
Grades:
Not Grade Specific
Types:
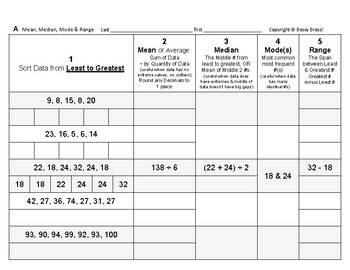
Stats&Data 05: Calculate Measures of Central Tendency Mean Median Mode & Range
This is an excerpt from my popular line ofBossy Brocci Math & Big Science workbooks on Amazon.Answer KEY included=======================Students will:1) Calculate Mean, Median, Mode and Rangefrom 10 different sets of Data or Numbers2) Be compelled to show their work in a neat & orderly format3) Be trained to methodically & systematically CalculateMeasures of Central Tendency Note: If you're looking for Box & Whisker Plots, then see my Stats&Data Lessons 06, 07, 08 and 09=====
Subjects:
Grades:
Not Grade Specific
Types:
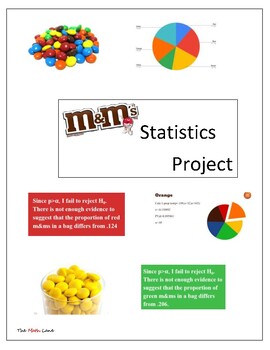
M&M Statistics 1 sample Proportion Hypothesis Test Project/Activity No Prep
Get ready to "yummify" your statistics class with this no prep project that will have your students conducting proportion hypothesis tests using everyone's favorite treat - M&Ms! Perfect for statistics or AP Statistics classes, this project offers two exciting options for implementation. For an engaging in-class activity, simply give each group a bag of M&Ms and watch as they compare proportions across groups or have students take a handful from a large bag to create their own sample. Th
Subjects:
Grades:
Not Grade Specific
Types:
CCSS:
Also included in: High School Statistics Project Bundle
Showing 1-24 of 155 results


