41 results
Statistics laboratories for homeschool
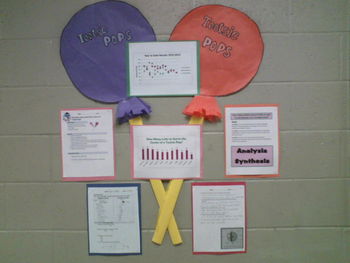
How Many Licks to the Center of a Tootsie Pop? Statistics!
Looking for novel way to get your middle school students excited about math and statistics?!
This file contains everything you need to conduct the experiment (except the Tootsie Pops!) that answers the age old question "How many licks does it take to get the center of a tootsie pop?" The lesson covers mean, median, mode, range, outliers, tables, graphs, box and whisker plots, data collection, pre and post discussion questions, experimental procedures, and student reflection. I also provided a s
Subjects:
Grades:
6th - 9th
Types:
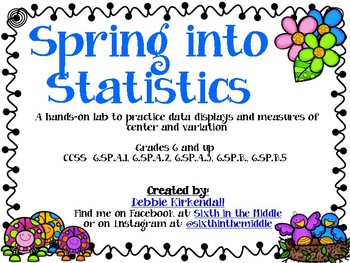
Spring into Statistics Data Displays and Measures of Center Lab
This is a hands-on lab that teaches about Statistical Questions, Data Displays (dot/line plot, histograms, box plots) and Measures of Center (mean, median, mode, and range). The lab includes notes pages, examples with answer keys, and a final project in which the student can survey classmates and create a "flower" by using their data to find mean, median, mode, range. They will also create a box plot, histogram and dot plot.

Sickle Cell Data Analysis: Hardy-Weinberg and Chi-Square
Want a great way to convert the "traditional" Hardy-Weinberg lab into a data problem set? Here it is! This is ideal for very small classes, where sample size could be an issue, busy classes, where you may need this for additional at-home practice, or very large classes, where the swapping of H-W cards could get too messy.Included is the full data problem set and teacher pages with the answer key.This data problem set covers:-genotypes and phenotypes-the Hardy-Weinberg equation, with application
Subjects:
Grades:
10th - 12th, Higher Education
Types:
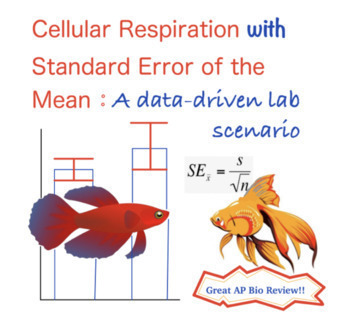
Cellular Respiration Think-it-Through Lab with Standard Error
This activity allows students to review basic concepts of cellular respiration in the context of a lab scenario. Students will work with data and complete calculations including percent change, mean, standard deviation, and standard error. In addition, students will see how error bars are drawn and learn how to interpret them on a graph. Activity A: Introduction (background, lab design, etc)Activity B: Working with data (percent change and mean calculations)Activity C: Calculating standard e
Subjects:
Grades:
9th - 12th, Higher Education, Adult Education
Types:
Also included in: Cell Resp Think-It-Through Lab with Standard Error and Answer Key
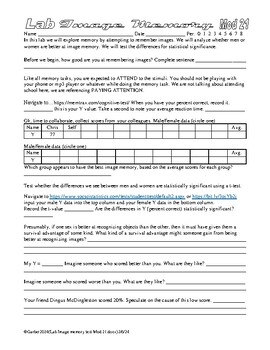
Psychology Lab Image Memory and Sex Differences AP Psychology Statistics
In this set of 13 labs the students do a variety of image memory tasks. They then collaborate and share data, then perform a T test on the data to find out if the differences between the scores of men and women are statistically significant. The students also test for correlations between a variety of scores. I suppose it is a sort of an expansion on my face memory lab. Links sometimes die, so try before you buy… https://www.psychologytoday.com/us/tests/iq/memory-test https://memtrax.com/cogniti
Subjects:
Grades:
9th - 12th, Higher Education, Adult Education
Types:
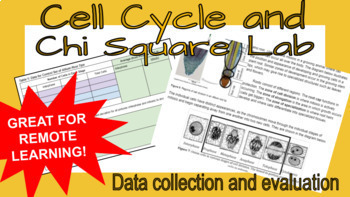
Cell Cycle Experimental Design Online Lab
Use data from real pictures of onion root tips to evaluate the effect of lectin on mitotic rate! A classic AP Biology Lab turned virtual for remote learning. Students use a google slide presentation to collect and share data, perform statistic testing (including standard deviation and Chi Square analysis) before evaluating the true effect of lectin on mitosis!Check out the data collection slides in the preview!
Subjects:
Grades:
9th - 12th, Higher Education, Adult Education, Staff
Types:
Also included in: Chi Square Bundle!

WHO'S YOUR DADDY? Corn Genetics Unit WITH Guided Inquiry Lab
50 PAGE Mendelian Genetics Unit with a Guided Inquiry Lab using an optional Chi-Squared Statistical Test.
This can be done as a lab or can just be used as a PowerPoint presentation on Genetics and/or Meiosis.
THIS LAB IS BEST USING THE REAL EARS OF CORN BUT CAN BE DONE WITH THE PHOTOS AT THE END. CORN EARS CAN BE OBTAINED FROM BIOLOGICAL SUPPLY COMPANIES OR YOUR GARDEN. :)
This lab covers the following concepts:
1. Corn Genetics, Monohybrids and Dihybrids
2. Corn (Plant) Reproduction (Ani
Subjects:
Grades:
7th - 12th, Higher Education, Adult Education

Wisconsin Fast Plants Online Simulation Lab
This comprehensive worksheet has students evaluate genetics using the free online lab through Gizmos (this simulation is currently FREE with the creation of an account (which is also FREE). Students will explore:- tracking parentage based on F1 and F2 phenotypes- statistical analysis using Chi Squared calculations - gene linkage evaluation and gene mapping using recombination frequencies Perfect for remote learning! Everything is included for guided learning AND independent practice to really g
Subjects:
Grades:
9th - 12th, Higher Education, Adult Education, Staff
Types:
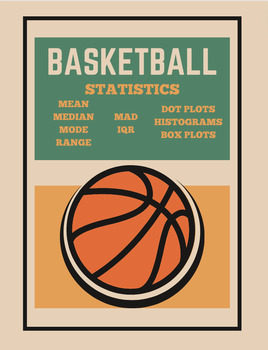
Basketball Statistics Project
Description: Engage your middle school students in the exciting world of basketball while reinforcing math and data analysis skills with this interactive Basketball Stats Project! This comprehensive resource is designed to captivate students' interest in both sports and mathematics, making learning both fun and meaningful.Take your students to the gym or outdoor playground hoop and they'll collect data on "How many baskets can ___ graders make in 60 seconds?" (the template is set to sixth grade
Subjects:
Grades:
5th - 8th
Types:
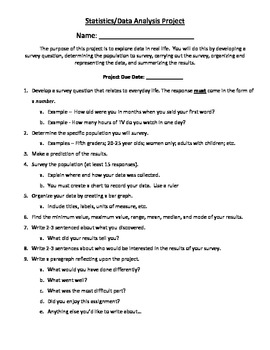
Real-Life Statistics Project
Students must think of a survey question that can be answered numerically. Then, they must go out into their community or school and ask at least 15 people their question. After collecting their data, they must find the minimum, maximum, range, mean, median, and mode. Also, they must graph their results, and answer a few reflection questions about their data.
I have my kids put all of this information on a poster or make a powerpoint presentation to show the class. I find this activity re
Subjects:
Grades:
4th - 8th
Types:
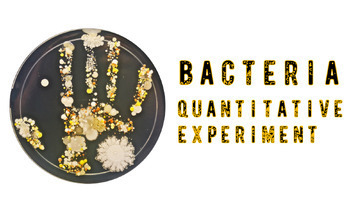
Bacteria Quantitative Experiment
This lesson teaches students how to apply quantitative methods to an experiment. Student’s T-Test Background Info introduces students to statistical hypothesis testing, alternative hypothesis, null hypothesis, and t-tests. After students learn about t-tests, they view the Bacteria Quantitative Experiment. This experiment compares the growth of bacteria on agar plates swabbed from hands that weren’t cleaned, and cleaned with hand sanitizer, regular soap, and antibacterial soap. There are pictures
Subjects:
Grades:
9th - 12th, Higher Education
Types:
Water Filtration
Students are challenged to filter contaminated water for safe consumption using their own designs. 3D print and non-3D print options included. Students will also experience a complete engineering design process, collect and analyze data, and will share their results and finally reflect on their experience. Teacher and student instructions included. Developed by a team of engineers and teachers.
Subjects:
Grades:
PreK - 5th
Types:
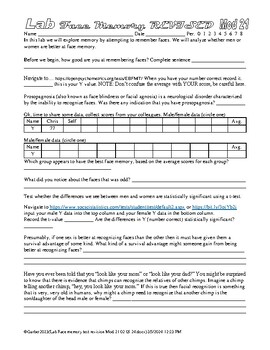
Psychology Lab Face Memory and Sex Differences AP Psychology Statistics
2/5/24 Updated link in lab. Did not update link in sample.In this lab the students do a face recognition activity on a website. They then collaborate and share data, then perform a T test on the data to find out if the differences between the scores of men and women are statistically significant. Links sometimes die so try before you buy… https://openpsychometrics.org/tests/EBFMT/ You have managed to find the source of the best Psychology and AP Psychology labs on TPT, go check out my store for
Subjects:
Grades:
9th - 12th, Higher Education, Adult Education
Types:
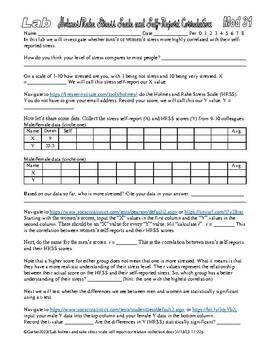
Psychology Lab Stress Correlations 2 AP Psychology Statistics Holmes Rahe
This is another version of my stress correlation labs, it simply relies on a different stress measurement tool.In this collection we make use of the Holmes and Rahe Stress Scale (HRSS) at… https://kresserinstitute.com/tools/holmes/ In this lab the students check the correlation between stress as measured by the HRSS and a variety of self-reports. I have included… Holmes and Rahe Stress and stress self-report Attending and Holmes and Rahe stress correlation Holmes and Rahe Stress and alertness s
Subjects:
Grades:
8th - 12th, Higher Education, Adult Education
Types:
Probability Carnival Project
Using Mr. Naussbaum's probability fair website (a free, typically unblocked, math game), Students will play common carnival games and use the slides to answer questions about the probability of outcomes.
Subjects:
Grades:
6th - 8th
Types:
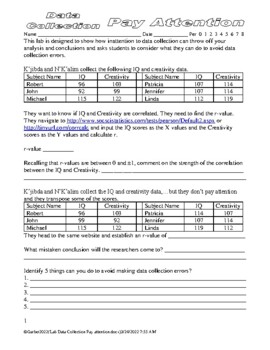
Data Collection: Pay Attention Correlation Statistics Psychology Methods
This lab is designed to show how inattention to data collection can throw off your analysis and conclusions and asks students to consider what they can do to avoid data collection errors. The best part is THAT THEY ARE ALL UNIQUE! Wait, what,…. Every single page is different to minimize copying and cheating! 495 different versions. The students are given a data collection scenario. In the first sample the students use a website to find the r-value of the data. Every assignment has an r-value of
Subjects:
Grades:
9th - 12th, Higher Education
Types:
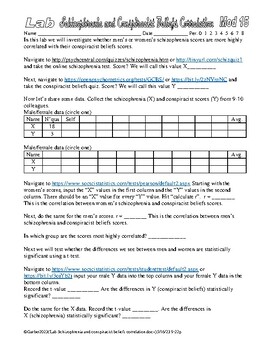
Psychology Schizophrenia and Conspiracist Beliefs Scores Correlation Statistics
In this lab we are finding out if men’s or women’s schizophrenia and conspiracist belief scores are more highly correlated.Students do the schizophrenia quizzes and conspiracist beliefs quiz, collaborate and share data then use a website to conduct the data analysis. It is inspired by this collection… https://www.teacherspayteachers.com/Product/Psychology-Lab-Trolley-Problem-Psychopathy-Scores-Correlation-Statistics-9499523 and the other correlation stuff I have set up…(I have a bunch, these are
Subjects:
Grades:
9th - 12th, Adult Education
Types:
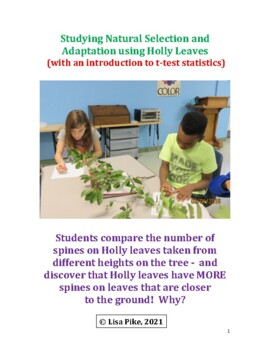
Holly Leaf Spines: an example of natural selection and adaptation
In this lab we will answer the question: Is the number of spines the same on leaves found at all heights on the Holly tree? Holly is just one example of the fluctuations in shape and form of an organism; the variation that any species can exhibit. It is important to recognize that this variation, or plasticity, is normal, and often relates to different environmental conditions (including competition and predation). The ability of an organism to change its characteristics in response to environ
Subjects:
Grades:
6th - 12th, Higher Education
Types:
NGSS:
HS-LS4-3
, HS-LS4-4
, MS-LS4-4
, MS-LS4-6
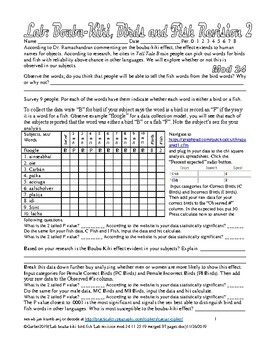
Psychology Lab Bouba Kiki Bird Fish lab Cognition Language
According to Dr. Ramachandran, commenting on synesthesia and the bouba-kiki effect, the effect extends to human names for objects. According to research he cites in Tell Tale Brain, people can pick out words for birds and fish with reliability above chance in other languages. We will explore whether or not this is observed in our population.Survey 24 non-psych friends. For each of the words have them indicate whether each word is either a bird or a fish.This is cool because my students almost al
Subjects:
Grades:
9th - 12th, Higher Education, Adult Education
Types:
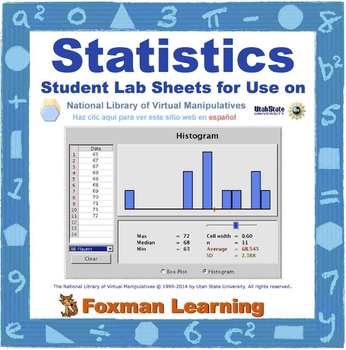
Statistics Graphs -- Virtual Manipulatives Lab for Middle School Math CCSS
This lab guides students through five of the statistics graphs virtual manipulatives (applets) from the nlvm website: Bar Chart, Pie Chart, Box Plot, Histogram, and Scatterplot. These virtual manipulatives are a great way for students to explore and compare various ways to represent data in a fun and conceptual format. My students really enjoy working through these labs and I enjoy the math understanding and discussions that follow. Five other nlvm labs for Middle School Math are available in M
Subjects:
Grades:
6th - 8th
Types:
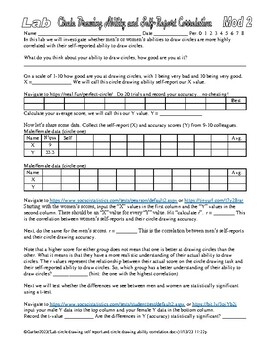
Psychology Lab Circle Drawing and Correlation Collection AP Psychology Stats
In this collection we make use of the circle drawing activity at… https://neal.fun/perfect-circle/ This collection contains a number of different versions. These will be useful if you want correlation data or if you are working on sensation and perception or dexterity,…use your imagination. In these labs, the statistical analysis is done by calculators on websites. If you teach stats you may want to block out the links and have the students work the calculations by hand….. or maybe even have the
Subjects:
Grades:
9th - 12th, Higher Education
Types:
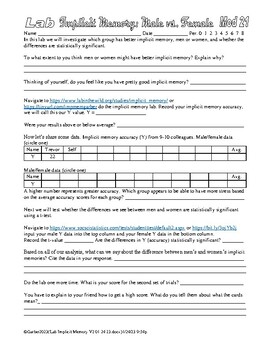
Psychology Lab Implicit Memory Test Cognition Statistics AP Psychology
I did a complete revision of this lab, the old website died. It is now a hard copy. In this lab the students navigate to https://www.labinthewild.org/studies/implicit_memory/ and do the implicit memory activity. They then collaborate to share data and perform a t-test to find out if the difference between male and female scores is statistically significant. You have managed to find the source of the best Psychology and AP Psychology labs on TPT, go check out my store for other awesome resources
Subjects:
Grades:
9th - 12th, Higher Education
Types:
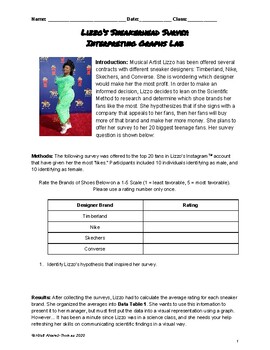
Lizzo's Sneakerhead Survey: Interpreting and Critiquing Bar Graphs
Resource includes a fictional scenario involving musical artist Lizzo revising and communicating data from a survey created for her profit. Guiding questions scaffold students to closely analyze various components of a well constructed bar graph and the revision process.
Subjects:
Grades:
9th - 12th
Types:
CCSS:
Gapminder Global and Local Energy Lab Activity
In this lab students will use an internet based charting software to research topics and implications of energy on local and global scales. Students will examine the energy cost and sources of their own state (prefilled for Illinois) and analyze changes in the energy use of United States and other countries selected by student. Students will demonstrate knowledge by responding to questions and writing prompts requiring analysis, justification and evaluation.
This lab is great for high level hig
Subjects:
Grades:
8th - 12th, Higher Education, Adult Education
Types:
Showing 1-24 of 41 results


