116 results
High school statistics lectures $5-10
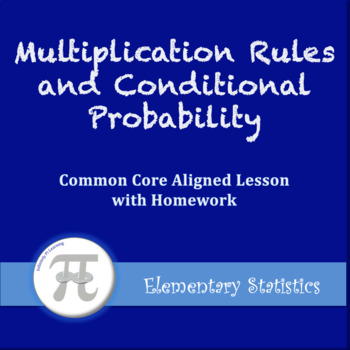
Multiplication Rules and Conditional Probability (Lesson with Homework)
Elementary Statistics - Multiplication Rules and Conditional ProbabilityCommon Core Aligned Lesson Plan HomeworkThis lesson plan includes:-Lecture Notes (PDF, PowerPoint, and SMART Notebook)-Blank Lecture Notes (PDF and SMART Notebook)-Homework (PDF and Word)-Answer Key (PDF)-Conditional Probability Demonstration Handout (PDF and Word)You do not need to have PowerPoint or SMART Notebook to receive the full benefits of this product. There are also PDF versions included!Lesson Objectives:-Find the
Subjects:
Grades:
10th - 12th, Higher Education
CCSS:
Also included in: Probability and Counting Rules Lesson Plan Bundle
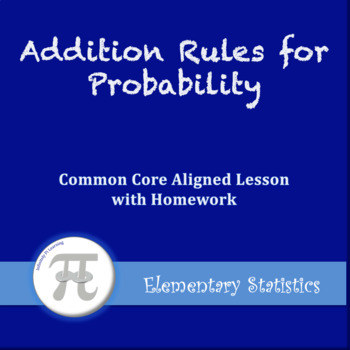
Addition Rules for Probability (Lesson with Homework)
Elementary Statistics - Addition Rules for ProbabilityCommon Core Aligned Lesson with HomeworkThis lesson plan includes:-Lecture Notes (PDF, PowerPoint, and SMART Notebook)-Blank Lecture Notes (PDF and SMART Notebook)-Homework (PDF and Word)-Answer Key (PDF)You do not need to have PowerPoint or SMART Notebook to receive the full benefits of this product. There are also PDF versions included!Lesson Objectives:-Determine if events are mutually exclusive.-Find the probability of compound events, us
Subjects:
Grades:
10th - 12th, Higher Education
CCSS:
Also included in: Probability and Counting Rules Lesson Plan Bundle

Data Collection, Sampling Techniques, and Studies (Lesson with Homework)
Elementary Statistics - Data Collection, Sampling Techniques, and StudiesCommon Core Aligned Lesson with HomeworkThis lesson plan includes:-Lesson Notes (PDF, PowerPoint, and SMART Notebook)-Blank Lesson Notes (PDF and SMART Notebook)-Homework (PDF and Word)-Answer Key (PDF)You do not need to have PowerPoint or SMART Notebook to receive the full benefits of this product. There are also PDF versions included!Lesson Objectives:-Identify the four basic sampling techniques.-Explain the difference be
Subjects:
Grades:
10th - 12th, Higher Education
CCSS:
Also included in: Introduction to Probability and Statistics Lesson Plan Bundle

Hypothesis Testing for the Mean (Lesson with Homework)
Elementary Statistics - Hypothesis Testing for the MeanCommon Core Aligned Lesson with HomeworkThis lesson plan includes:-2 Days of Lesson Notes (PDF, PowerPoint, and SMART Notebook)-2 Days of Blank Lesson Notes (PDF and SMART Notebook)-Normal Distribution Table (PDF)-T Distribution Table (PDF)-2 Days of Homework (PDF and Word)-Answer Keys (PDF)You do not need to have PowerPoint or SMART Notebook to receive the full benefits of this product. There are also PDF versions included!Lesson Objectives
Subjects:
Grades:
10th - 12th, Higher Education
CCSS:
Also included in: Confidence Intervals and Hypothesis Testing Lesson Plan Bundle
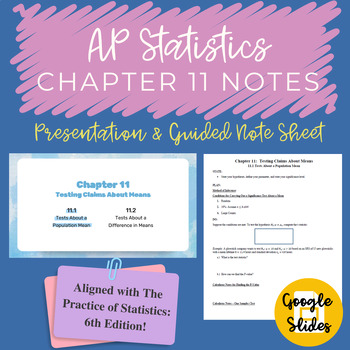
AP Statistics Chapter 11 Notes Google Slides and Guided Notes
Aligned with The Practice of Statistics (Sixth Edition); a presentation for the eleventh full chapter of AP Statistics (11.1 and 11.2 ), Testing Claims About Means. Includes: Tests About a Population Mean; and Tests About a Difference in Means. This file includes PowerPoint presentations for 11.1 and 11.2, along with their associated guided notes.This file is in Google Slides format for the presentation and a PDF of the notes. If you prefer PowerPoint, I have another file in my store that would
Subjects:
Grades:
10th - 12th
CCSS:
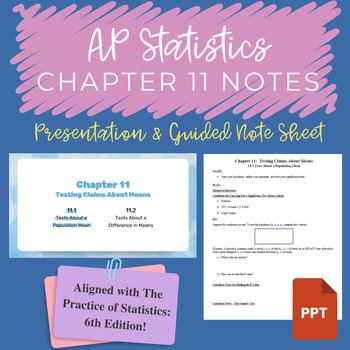
AP Statistics Chapter 11 Notes PowerPoint and Guided Notes
Aligned with The Practice of Statistics (Sixth Edition); a presentation for the eleventh full chapter of AP Statistics (11.1 and 11.2 ), Testing Claims About Means. Includes: Tests About a Population Mean; and Tests About a Difference in Means. This file includes PowerPoint presentations for 11.1 and 11.2, along with their associated guided notes.This file is in PowerPoint format for the presentation and a PDF of the notes. If you prefer Google Drive, I have another file in my store that would b
Subjects:
Grades:
10th - 12th
CCSS:
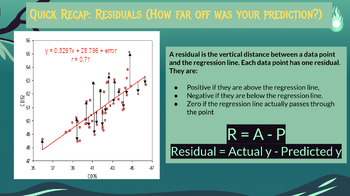
Lesson 3: Two Variable Data: Statistics (correlation, regressions, scatter plot)
Hello!This is a lesson (powerpoint) on two-variable data. It includes vocabulary and guided practice on how to create scatter plots, calculate and interpret correlation, and write regression lines. This lesson should span through two weeks. You can find supplementary activities to this lesson on my storefront! If you teach StatsMedic, it's aligned to the cadence of StatsMedic lessons and activities. This resource is best downloaded to Google Drive and then edited as needed for your students. Ple
Subjects:
Grades:
10th - 12th
Types:
CCSS:

Confidence Intervals for the Mean (Lesson with Homework)
Elementary Statistics - Confidence Intervals for the MeanCommon Core Aligned Lesson with HomeworkThis lesson plan includes:-2 Days of Lecture Notes (PDF, PowerPoint, and SMART Notebook)-2 Days of Blank Lecture Notes (PDF and SMART Notebook)-Normal Distribution Table (PDF)-T Distribution Table (PDF)-2 Days of Homework (PDF and Word)-Answer Keys (PDF)You do not need to have PowerPoint or SMART Notebook to receive the full benefits of this product. There are also PDF versions included!Lesson Object
Subjects:
Grades:
10th - 12th, Higher Education
CCSS:
Also included in: Confidence Intervals and Hypothesis Testing Lesson Plan Bundle
The Normal Distribution (Lesson with Homework)
Elementary Statistics - The Normal DistributionCommon Core Aligned Lesson Plan with HomeworkThis lesson plan includes:-Lecture Notes (PDF, PowerPoint, and SMART Notebook)-Blank Lecture Notes (PDF and SMART Notebook)-Normal Distribution Table (PDF)-Homework (PDF and Word)-Answer Key (PDF)You do not need to have PowerPoint or SMART Notebook to receive the full benefits of this product. There are also PDF versions included!Lesson Objectives:-Identify the properties of a normal distribution.-Find th
Subjects:
Grades:
10th - 12th, Higher Education
CCSS:
Also included in: Distributions of Data Lesson Plan Bundle
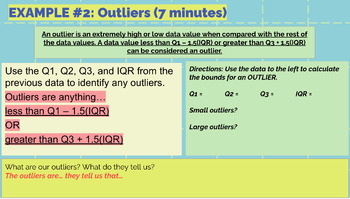
Lesson 2 PPT: One-Variable Data: Box Plots, Measures of Center and Variability
Hi! This is Part 2 of the lessons for One Variable Data for High School Statistics. Part 1 can be found on my product listings in my store. This lesson covers measures of central tendency (mean, median, mode), measures of variability (range, standard deviation, IQR), and how to create box plots. It includes guided practice during the lesson and think-write-pair-shares for students to engage in during the lesson.It's best downloaded into Google Drive and edited as you need for your class. If you
Subjects:
Grades:
10th - 12th
Types:
CCSS:
Organizing Data Using Frequency Distributions (Lesson with Homework)
Elementary Statistics - Organizing Data Using Frequency DistributionsCommon Core Aligned Lesson with HomeworkThis lesson plan includes:-Lesson Notes (PDF, PowerPoint, and SMART Notebook)-Blank Lesson Notes (PDF and SMART Notebook)-Homework (PDF and Word)-Answer Key (PDF)You do not need to have PowerPoint or SMART Notebook to receive the full benefits of this product. There are also PDF versions included!Lesson Objectives:-Organize data using a frequency distribution.Common Core Standards:S.ID.1
Subjects:
Grades:
10th - 12th, Higher Education
CCSS:
Also included in: Introduction to Probability and Statistics Lesson Plan Bundle
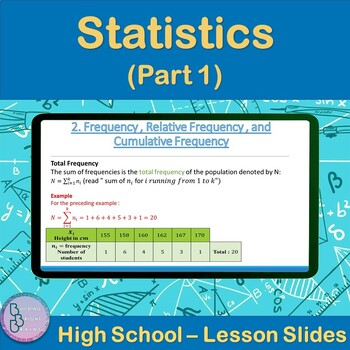
Statistics Part 1 | High School Math PowerPoint Lesson Slides
Are you teaching your High School students about Statistics? Plenty of examples and application exercises are included. You can also easily convert this to a Google Slides lesson by dragging it into your Google Drive.What is included?✦ 30 total slides for notes, examples and applications.✦ All steps are animated to allow the teacher to explain them gradually. Throughout the Lesson, students will be introduced to the following:✦ Statistics Vocabulary✦ Frequency , Relative Frequency , and Cumulati
Subjects:
Grades:
10th - 12th, Higher Education
Introduction to Probability (Lesson with Homework)
Elementary Statistics - Introduction to ProbabilityCommon Core Aligned Lesson with HomeworkThis lesson plan includes:-Lecture Notes (PDF, PowerPoint, and SMART Notebook)-Blank Lecture Notes (PDF and SMART Notebook)-Homework (PDF and Word)-Answer Key (PDF)You do not need to have PowerPoint or SMART Notebook to receive the full benefits of this product. There are also PDF versions included!Lesson Objectives:-Determine the sample space of a probability experiment.-Define and calculate the complemen
Subjects:
Grades:
10th - 12th, Higher Education
CCSS:
Also included in: Probability and Counting Rules Lesson Plan Bundle
Summarize Data Using Technology Activity
Summarize Data Using Technology Activity (Elementary Statistics Activity)Activity DescriptionThis activity covers the basics of summarizing data in a graphing calculator or in spreadsheet software. Students will learn how to input raw data and then use technology to find measures of central tendency, measures of position, and measures of spread to describe the data.Activity Evaluation: Students will have the option to save and turn in the spreadsheet they created during the activity. Evaluation
Subjects:
Grades:
10th - 12th, Higher Education
Types:
Also included in: Introduction to Probability and Statistics Lesson Plan Bundle
Introduction to Statistics and Types of Data (Lesson with Homework)
Elementary Statistics - Introduction to Statistics and Types of DataCommon Core Aligned Lesson with HomeworkThis lesson includes:-Lesson Notes (PDF, PowerPoint, and SMART Notebook)-Blank Lesson Notes (PDF and SMART Notebook)-Homework (PDF and Word)-Answer Key (PDF)You do not need to have PowerPoint or SMART Notebook to receive the full benefits of this product. There are also PDF versions included!Lesson Objectives:-Demonstrate knowledge of statistical terms.-Differentiate between the two branch
Subjects:
Grades:
10th - 12th, Higher Education
CCSS:
Also included in: Introduction to Probability and Statistics Lesson Plan Bundle
Graphs and Charts in Statistics (Lesson with Homework)
Elementary Statistics - Graphs and Charts in Statistics (Bar Graphs, Time Series Graphs, Pie Graphs, Stem and Leaf Plots)Common Core Aligned Lesson with HomeworkClick here for Histograms and Dot PlotsThis lesson plan includes:-Lesson Notes (PDF, PowerPoint, and SMART Notebook)-Blank Lesson Notes (PDF and SMART Notebook)-Homework (PDF and Word)-Answer Key (PDF)You do not need to have PowerPoint or SMART Notebook to receive the full benefits of this product. There are also PDF versions included!Le
Subjects:
Grades:
10th - 12th, Higher Education
CCSS:
Also included in: Introduction to Probability and Statistics Lesson Plan Bundle
Data Mining Preprocessing Data (Unit 3) - Lesson Slides
Description Data Mining Preprocessing Data (Unit 3) - Lesson Slides contains 70 READY TO USE slides that can be used as a learning unit for a high school or introductory college level course in data mining or a related field. The slides cover conceptual information and serve in lieu of a textbook (no textbook is followed). The material assumes no prerequisite knowledge or experience and these slides can be used by an instructor new to the field or experienced. This lesson set is part of a six-un
Grades:
10th - 12th, Higher Education
Also included in: Data Mining COMPLETE COURSE
Histograms and Dot Plots (Lesson with Homework)
Elementary Statistics - Histograms and Dot Plots (Frequency Distributions)Common Core Aligned Lesson with HomeworkThis lesson plan includes:-Lesson Notes (PDF, PowerPoint, and SMART Notebook)-Blank Lesson Notes (PDF and SMART Notebook)-Homework (PDF and Word)-Answer Key (PDF)You do not need to have PowerPoint or SMART Notebook to receive the full benefits of this product. There are also PDF versions included!Lesson Objectives:-Represent data and frequency distributions graphically using histogr
Subjects:
Grades:
10th - 12th, Higher Education
Also included in: Introduction to Probability and Statistics Lesson Plan Bundle
Measures of Position (Lesson with Homework)
Elementary Statistics - Measures of Position (Quartiles and Five Number Summary)Common Core Aligned Lesson with HomeworkThis lesson plan includes:-Lesson Notes (PDF, PowerPoint, and SMART Notebook)-Blank Lesson Notes (PDF and SMART Notebook)-Homework (PDF and Word)-Answer Key (PDF)You do not need to have PowerPoint or SMART Notebook to receive the full benefits of this product. There are also PDF versions included!Lesson Objectives:-Find the measures of position in a set of data. (Quartiles)-Use
Subjects:
Grades:
10th - 12th, Higher Education
CCSS:
Also included in: Introduction to Probability and Statistics Lesson Plan Bundle

Measures of Central Tendency (Lesson with Homework)
Elementary Statistics - Measures of Central TendencyLesson with HomeworkThis lesson plan includes:-Lecture Notes (PDF, PowerPoint, and SMART Notebook)-Blank Lecture Notes (PDF and SMART Notebook)-Homework (PDF and Word)-Answer Key (PDF)You do not need to have PowerPoint or SMART Notebook to receive the full benefits of this product. There are also PDF versions included!Lesson Objectives:-Summarize data using measures of central tendency, such as themean, median, mode, and midrange.Common Core St
Subjects:
Grades:
10th - 12th, Higher Education
Also included in: Introduction to Probability and Statistics Lesson Plan Bundle

Hypothesis Testing for Variance and Standard Deviation (Lesson with Homework)
Elementary Statistics - Hypothesis Testing for Variance and Standard DeviationCommon Core Aligned Lesson with HomeworkThis lesson plan includes:-Lesson Notes (PDF, PowerPoint, and SMART Notebook)-Blank Lesson Notes (PDF and SMART Notebook)-Chi-Square Distribution Table (PDF)-Homework (PDF and Word)-Answer Key (PDF)You do not need to have PowerPoint or SMART Notebook to receive the full benefits of this product. There are also PDF versions included!Lesson Objectives:-Test variances and/or standar
Subjects:
Grades:
10th - 12th, Higher Education
CCSS:
Also included in: Confidence Intervals and Hypothesis Testing Lesson Plan Bundle
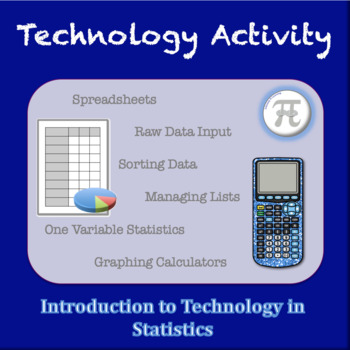
Introduction to Technology in Statistics Activity
Introduction to Technology in Statistics (Elementary Statistics Activity)Activity DescriptionThis is a perfect activity for a beginning statistics class! This activity takes students through the basics of data input into a graphing calculator or a spreadsheet.Activity Evaluation: Students will have the option to save and turn in the spreadsheet they created during the activity. Evaluation for the graphing calculator portion must be by teacher observation, depending on the technology available in
Subjects:
Grades:
10th - 12th, Higher Education
Types:
CCSS:
Also included in: Introduction to Probability and Statistics Lesson Plan Bundle
Measures of Variation (Lesson with Homework)
Elementary Statistics - Measures of Variation (Range, Variation, and Standard Deviation)Common Core Aligned Lesson with HomeworkThis lesson plan includes:-Lesson Notes (PDF, PowerPoint, and SMART Notebook)-Blank Lesson Notes (PDF and SMART Notebook)-Handout (PDF and Word)-Homework (PDF and Word)-Answer Key (PDF)You do not need to have PowerPoint or SMART Notebook to receive the full benefits of this product. There are also PDF versions included!Lesson Objectives:-Describe data using measures of
Subjects:
Grades:
10th - 12th, Higher Education
CCSS:
Also included in: Introduction to Probability and Statistics Lesson Plan Bundle
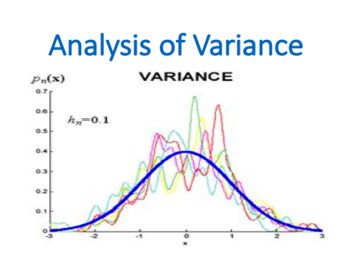
Analysis of Variance (ANOVA) (Statistics)
Analysis of Variance (ANOVA) is a lecture which is covered within the Statistic or Basic Business Statistic module by business and economics students.Analysis of variance, known by the acronym ANOVA, allows statistical comparison among samples taken from many populations. While ANOVA literally does analyze variation, the purpose of ANOVA is to reach conclusions about possible differences among the means of each group, analogous to the hypothesis tests of the previous chapter. Every ANOVA design
Subjects:
Grades:
5th - 12th, Higher Education, Adult Education, Staff
Types:
Also included in: Statistics Module Bundle
Showing 1-24 of 116 results


