11 results
4th grade statistics outlines

My Survey: A Data Management Project
This is a fun culminating task for your data management unit. With step-by-step instructions, students prepare a survey question, a tally chart and a bar graph using data that they have collected when conducting their survey. They then find the mode, range and median of their data, and draw conclusions based on their findings. A rubric for assessment is also included.
_______________________________________________________
Please consider leaving feedback on this item to earn credit towar
Subjects:
Grades:
3rd - 5th
Types:
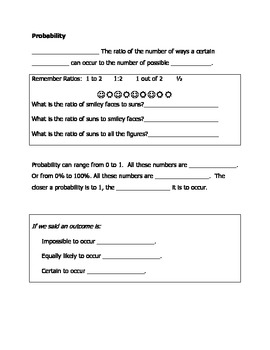
Interactive Notebook Probability Guided Notes: Theoretical vs Experimental
Guided notes discussing the concepts of Probability as a ratio, fraction, and percent. Further discussion compares Theoretical and Experimental Proability, the definitions, and forumulas to calculate. For 5th - 8th grade general education or special education classrooms. Great for your interactive notebooks.
Subjects:
Grades:
4th - 9th
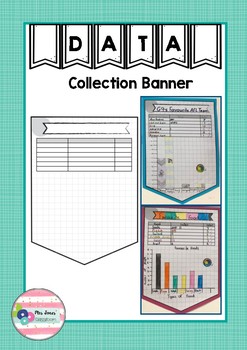
Data Collection Banner
Are your students collecting their own data and representing it using a graph this term? Then why not get them presented on this banner pendant and display them in your room.
Subjects:
Grades:
1st - 10th
Types:
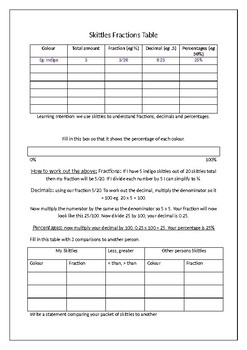
Skittles Fractions and decimals table
In this activity each of the students is given 20 skittles at random. They have to insert the amount and colours into their table. The object of the investigation is to then try and work out the fractions, decimals and percentages of each of their different colours of skittles.
Their are a series of questions and activities related to ratios of skittles to their fractions that the students can complete if they are at a higher level.
The students loved this activity especially when they found o
Subjects:
Grades:
3rd - 8th
Types:
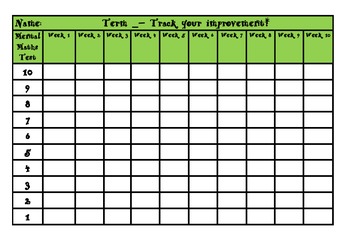
Track your improvement - mental maths graph!
Here is a printable that you can give to your students, which will help them to graph their weekly mental maths test results! Each set contains the most commonly sized mental maths tests - a graph for 10, 15, 20 and 30 questions. I have found that students achieve the best results when they can see themselves improving, and have to physically colour in a graph each week. They love trying to beat their score! This is great to put into their portfolio or take home folder so that parents (and stude
Subjects:
Grades:
2nd - 7th
Types:

Scaffolded Notes: Mean, Median, & Mode
These are scaffolded notes over mean, median, and mode. They contain definitions, examples, explanations, and pictures to provide a full picture of what each term means. I have my students paste these notes into their math journals. They reference them all the time when working out related problems! (PDF file).
Subjects:
Grades:
4th - 6th
Types:
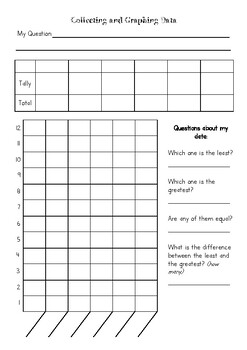
Collecting and graphing data
Surveying, collecting, graphing & interrupting a data set ALL IN ONE.Use this as part of your Maths session to assist students with various skills.
Subjects:
Grades:
2nd - 6th
Types:
Million Dollar Project
This is an integrated unit for students in 4th - 6th grade inviting them to plan, present and persuade a panel of humanitarians to give away 1 million dollars to charity.
Subjects:
Grades:
4th - 6th
Pictographs Anchor Chart
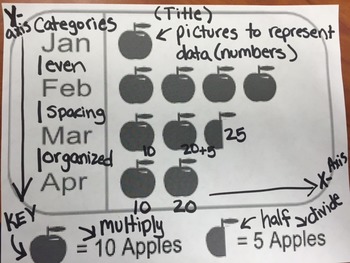
Pictographs Anchor Chart
TEKS 2.10 B- The student will organize a collection of data with up to 4 categories using pictographs and bar graphs with intervals of one or more
TEK 2.10 C-The student will write and solve one step word problems involving addition or subtraction using data represented within pictographs and bar graphs with intervals of one
Subjects:
Grades:
1st - 4th
Types:
Engineering Design Process Example - STEM Story with PBL
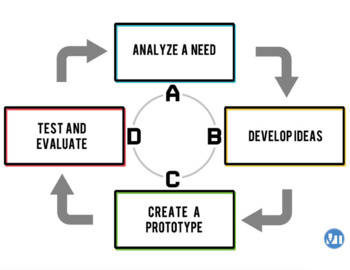
These free resources provide educators with a STEM-focused, low-budget, step-by-step engineering design process (EDP) example with project-based learning (PBL). The problem to solve for students is to build a prototype of a seaworthy aluminum watercraft to hold as much cargo (pennies) as possible. The STEM story is The Three Little Pigs!The files included are:- GRASPS Scenario for the Aluminum Watercraft Problem (12 slides)- Vocabulary Terms and Materials List for the Aluminum Watercraft Problem
Subjects:
Grades:
4th - 7th
Types:
NGSS:
MS-ETS1-2
, 3-5-ETS1-3
, MS-ETS1-4
, 3-5-ETS1-1
, MS-ETS1-1
...
Pie Chart Notes
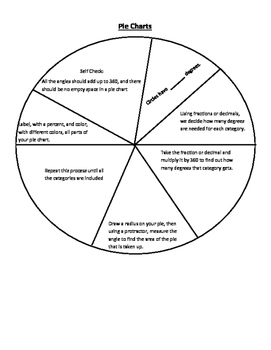
Here is a quick guide to help students create their own pie charts. Includes guided notes and pie chart template.
Subjects:
Grades:
4th - 9th
Showing 1-11 of 11 results


