43 results
Graphing posters for Microsoft Word
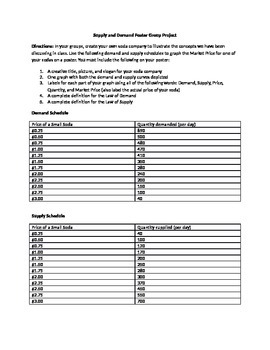
Supply and Demand Poster Group Project
I use this lesson as a summative authentic assessment for the Economic concepts of the Laws of Supply and Demand, Supply and Demand Curves, and Market Price (Equilibrium).
I divide my students into groups of 3-4 and have them create their own unique soda, product slogan, and graph the given supply and demand schedules to find the Market Price for their new soda.
This lesson requires poster paper, markers/colored pencils, and rulers and will take about an hour to complete.
This lesson inclu
Subjects:
Grades:
9th - 12th
Types:
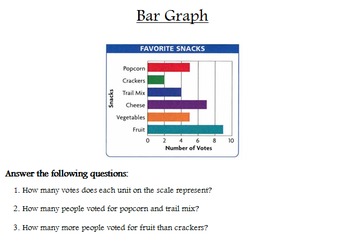
Interpreting Graphs Posters (Line Plot, Bar Graph, Line Graph, Etc)
Students practice interpreting several types of different graphs including line plot, bar graph, line graph, pictograph, double line graph, histogram, circle graph, and stem-and-leaf plot. Poster size sheets, so you can have students rotate in small groups or use in a math center. Answer key is included. I have a free graphic organizer that you can download that will help students learn about the different types of graphs first. Check it out!
Grades:
3rd - 7th
Types:
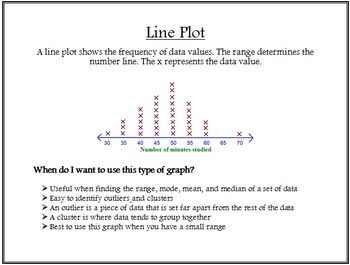
Types of Graphs Posters
Students will explore a variety of different types of graphs and learn about the characteristics and advantageous traits of each type. These posters include the following types of graphs: bar graph, line graph, pictograph, circle graph, line plot, histogram, stem-and-leaf plot, and double line graph. You can display these posters in your classroom for student reference. You can also download my free product named "Types of Graphs Graphic Organizer" and use the posters to help students explore th

Graphing & Data Analysis Disney 4 Park Challenge
Students will practice graphing multiple sets of data using real time data of Disney park wait times. Student scenario: Your group is doing the 4 parks in one day challenge which means park hopping all 4 Disney Parks in one day! You will need to decide on one ride from each of the 4 parks you’d like to ride most and create a poster graphing the hourly wait times comparing the 4 rides so you can map out your day strategically. Students are also given information about the fast pass prices and wil
Subjects:
Grades:
6th - 10th
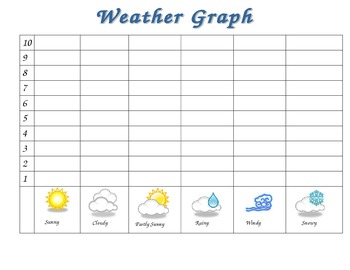
Weather Graph and Tally Chart
Perfect for checking weather in the morning with your class! You can use this as a whole class or individually.
Included are:
1 Weather Graph Recording Sheet
1 Weather Tally Recording Sheet
Subjects:
Grades:
PreK - 2nd
Types:
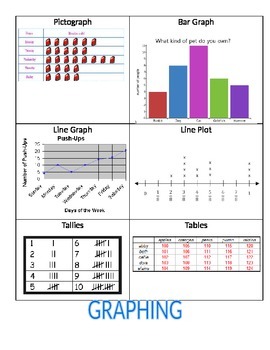
Graphing anchor chart
This small chart will help students remember the types of graphs.
Grades:
3rd - 6th
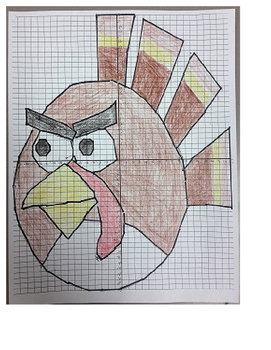
Have a Grumpy Thanksgiving!
This is a fun activity for the sixth, seventh or eighth grade math class or special education classroom that involves a four quadrant coordinate plane. It has some half spaces represented by decimals so this may have to be pre-taught. When finished, feel free to color it however you see fit. Good for the days around Thanksgiving or for homeschooled children.
Subjects:
Grades:
6th - 8th
CCSS:
Common Core Math - Measurement and Data for First Grade
Common Core Math Standards - Measurement and Data
Colorful Student Practice Pages aligned to the common core.
Each page has an "I can" statement and the math standard being covered. Two practice pages for each standard.
"I Can" Statements to laminate and hang in the classroom.
This packet is also available in the bundle of practice pages with all standards.
Created by Catdogteaches
Subjects:
Grades:
K - 2nd
Types:
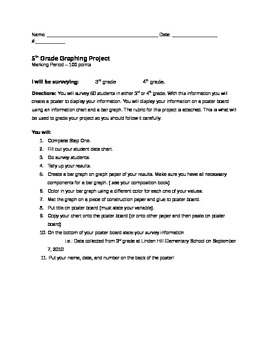
Graphing and Surveying Project
A graphing and Surveying Project for students to get a better idea of how to create different types of graphs. I have used this with fourth and fifth grades and it was fantastic!
The attachment includes: Step by Step directions for the project, a brainstorming sheet, a chart to take the survey on, a written response sheet, and a rubric to grade students.
Graphing and Surveying Project is licensed under a Creative Commons Attribution 3.0 United States License.
Subjects:
Grades:
3rd - 6th
Types:
Star Light, Star Bright
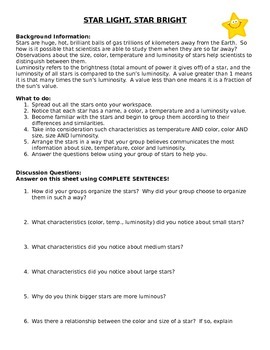
The beginning of this activity was not created by me, but the manipulative extension for it was. In this activity the purpose is for students to categorize the star cards into similar groups. Students may choose to use Color, Luminosity, Magnitude, or Temperature. In the first sheet of the handout there are questions about how and why they grouped the stars the way the did. There are also follow up questions making relationships about all four categories. The second part of the activity has
Subjects:
Grades:
5th - 9th
Types:
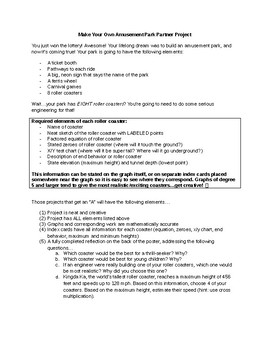
Graphing Polynomials Rollercoaster Project
A multi-day project that requires students to write and graph polynomial functions, reflecting on real-world applications.
Subjects:
Grades:
10th - 11th
Types:
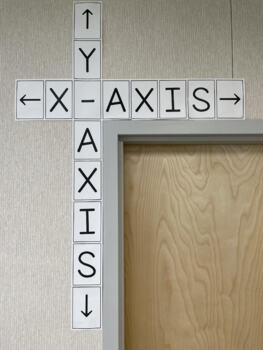
Axis Labels
Create an axis in the corner or your room (whiteboard, door frame, etc).
Grades:
5th - 12th
Types:
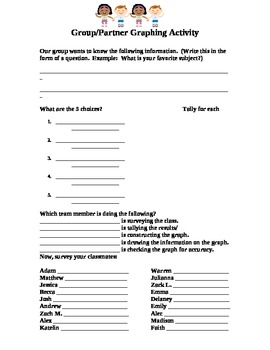
Cooperative Group Graphing Project
Students will work in cooperative groups to determine a questions on which they would like to poll the class. Each team member will have a specific job to do.After the poll and tally the results, students will create a large graph to display their data. A grading sheet is included.
Grades:
4th - 6th
Types:
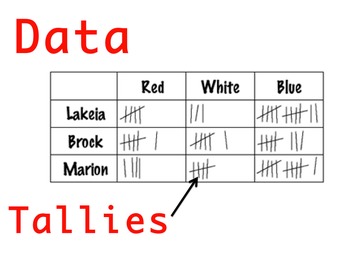
Editable Graphing Vocabulary Cards
Use these graphing vocabulary cards for your wall or bulletin board.
Words included:
Purpose
Data
Tallies
Results
Analysis
Bar Graph
Line Plot
Pictograph
Subjects:
Grades:
2nd - 4th
QR code Scavenger Hunt: Integers & the coordinate plane
Have students use QR scanners to answer questions about the coordinate plane & integers while going on a scavenger hunt around your classroom! All questions are aligned to Common Core standards for 6th grade math. Answer Key and worksheet for students is attached in the last 3 pages of the file!
Subjects:
Grades:
6th
Types:
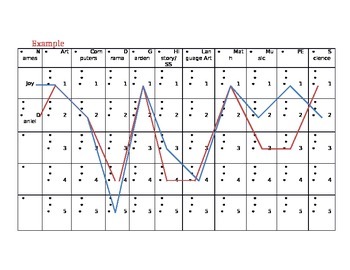
Subject Preferences Graph
This is a beginning of the year activity.
Getting to know your students and gaining insight to the overall trends of your year ahead.
This is a two-part task; first your students will find the trends in their table groups (small groups of 4 – 5 students). Second, you will graph the student data on a long poster or pin board. After each of the two tasks, students share three+ truths about the graphs.
Grades:
4th - 6th
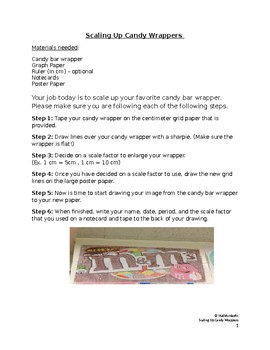
Scale Up Candy Wrappers
You will be using Candy Bar Wrappers to have students practice scaling up.
Subjects:
Grades:
5th - 8th
Types:
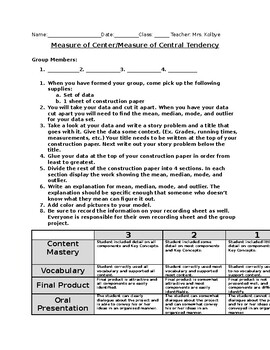
Measure of Center Practice
Here is an activity you can do with your students after introducing mean, median, mode, and outlier. It is designed to be a group assignment they can complete in one class period. I had my students present them the following class period. You can make up your own data set.
Subjects:
Grades:
5th - 7th
Types:
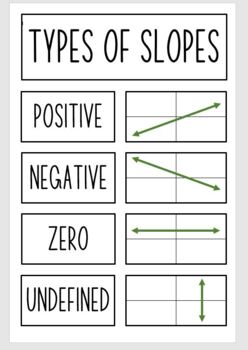
Slope of Lines Poster
Print on 12 by 18 poster paper. Our copy machine at school can fit a 12 by 18 inch poster paper in the multipurpose tray. Make sure you select the correct printer to be able to include all information on one page.I laminate mine so I can put it up and take it down when we are learning about linear equations in 8th grade.
Grades:
8th - 12th
Types:
Also included in: Middle School Math Poster Bundle
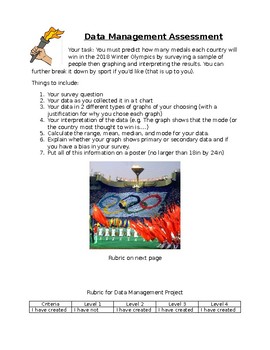
Data Management Assessment- Olympic Theme
This is aligned with grade 6-7 Ontario curriculum for Math. It also encompasses a connection to the Olympics. There is an instruction sheet and rubric posted with this assessment.
Grades:
5th - 7th
Types:
Conic Card Sort (and Optional Poster Project)
This card sort (with optional poster project) was designed for my algebra 2 class. The cards include the standard equations, key parts of each equation/graph, example equations, example key points, and example graphs. The students will need to sort them into one of the following categories: absolute value, parabola, circle, ellipses, or hyperbola. (Although absolute value is not a conic section I placed it here for my class in an effort to fit all necessary information into our time frame.) The
Subjects:
Grades:
9th - 12th
Types:
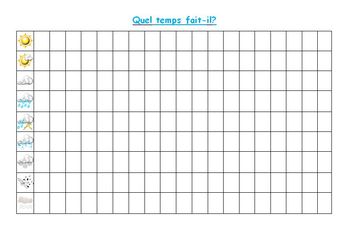
Weather graph for calendar wall
I laminated my copy of this graph so my students could use dry erase markers on it. Every month, I erase it and we restart!
Grades:
PreK - 2nd
Types:
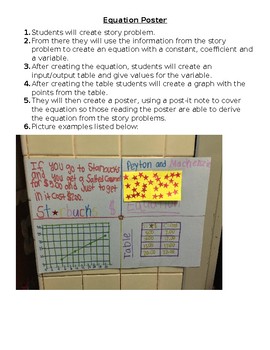
Equation Poster
Students will create their own equation, input/output table, and graph. They will then create a poster with this information.
Showing 1-24 of 43 results


