314 results
4th grade graphing graphic organizers
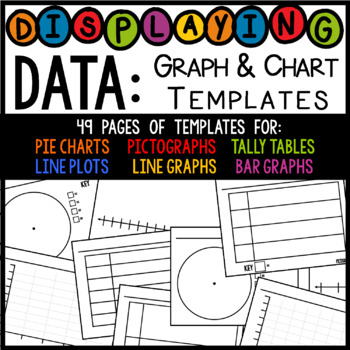
Displaying Data: Graph, Table, and Chart Templates (PDF & PNG)
These forms can be used for almost anything having to do with displaying data in a visual form. I've included the most popular graphs and tables used in elementary school. All templates below come in a PDF and a PNG. You can use the PNG to edit the graphs and charts in PowerPoint by using text boxes. Pie ChartsThere are 7 options for pie charts (2 to 9 categories). Line PlotsThere are 4 options for line plots: 5 lines, 7 lines, 13 lines, 18 lines. PictographsThere are 5 options for pictograph
Grades:
1st - 8th
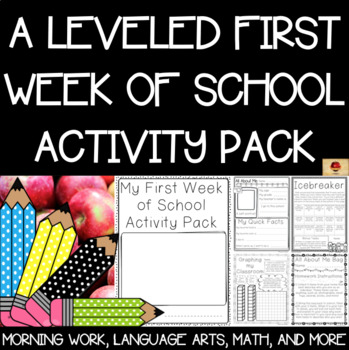
The First Week of School Complete Activity Packet
Welcome your students back to school with this leveled activity packet that includes getting to know each other activities, writing, math, language arts, cut and paste schedule-learning morning work, and more! Each activity comes with both primary and intermediate styled page(s), to help reach all learners in your classroom. SEE THE PREVIEW FOR ALL THAT IS INCLUDED WITHIN THIS RESOURCE! Included in this pack:“All About Me” Leveled Graphic Organizers with matching Leveled Informative Writing Page
Subjects:
Grades:
1st - 5th
Types:
Blank Bar Graph/Double Bar Graph Template
This is a bar graph template that can be used by teachers to teach students how to understand bar graphs and create their own bar graphs. Teachers can use this template teach students about parts of a bar graph and how to interpret data in bar graphs.
Grades:
1st - 12th
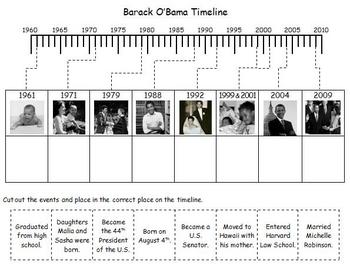
President's Day - Barack Obama Photo Timeline
Students will learn about the important events in Barack Obama's life as they complete this photo timeline. Two versions are included, one for upper elementary and one for lower elementary.
Subjects:
Grades:
1st - 6th
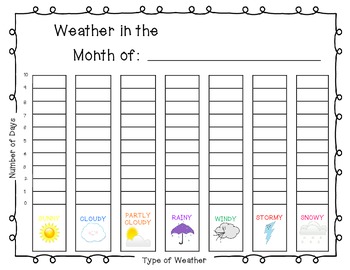
Weather Bar Graph
- Use this weather bar graph to collect daily data about the weather as part of your calendar routine. Save all the completed bar graphs and at the end of the school year have students analyze the data. Which month was the sunniest? How many more days did it rain in October than September? etc.
- Use it during your common core unit on data.
Graphics from: www.mycutegraphics.com
Grades:
K - 5th
Blank Line Graph Template
Check out this simple and student friendly line graph template that teachers can easily use to teach students the parts of a line graph and use as they build their foundational skills. Apply best practice skills and use every minute of instruction by not wasting time by having students draw out their sloppy lines and simply glue this template in their math notebooks or take home with them to work on HW :) Also includes a side by side page for extra practice space!
Hashtag Teached Resources by #
Subjects:
Grades:
2nd - 9th
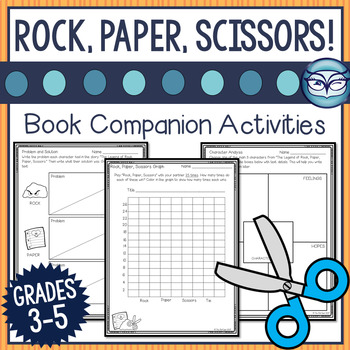
Rock Paper Scissors Reading Comprehension Activities
These book companion activities are perfect for your students to have fun with the popular book "The Legend of Rock, Paper, Scissors"! All kids love to play this game, so why not make it a classroom learning experience, focusing on reading comprehension, character analysis, and math?This companion activity pack allows students to explore the characters in "The Legend of Rock, Paper, Scissors," the different problems they faced, how they went about to solve their problems, summarizing, a fun writ
Grades:
3rd - 5th
Pictograph Template, Data and Graphing Picture Graph Template, Word File (.docx)
Enhance your elementary data and graphing unit with an editable pictograph template. I've created this picture graph template as a table within a Microsoft Word document (.docx) so that you can easily adapt it to suit your needs. PDF and jpg versions are also included.
Common Core Math Standards:
3.MD.B.3 - Draw a scaled picture graph and a scaled bar graph to represent a data set with several categories.
2.MD.D.10 - Draw a picture graph and a bar graph (with single-unit scale) to represent a
Subjects:
Grades:
PreK - 5th
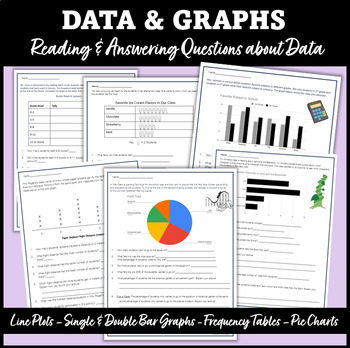
Read, Analyze & Interpret Different Types of Graphs, Graphing Worksheets
Need a graphing unit? This easy and ready to print digital graphing resource is great for 3rd grade and up and can be used in small groups, for math tutors, if you are homeschooling your child, or it can be used as math worksheets for substitutes. This printable graphing resource is a bundle and includes multiple practice worksheets on a variety types of graphs and charts with questions to help students learn how to read, interpret, and analyze different types of graphs. This resource includes:-
Grades:
3rd - 7th
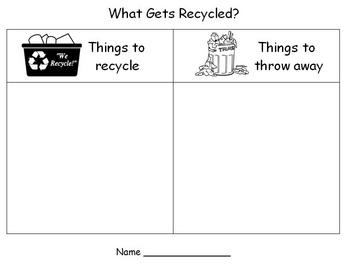
Earth Day - Recycling Sort
Kindergarten and first grade students will increase their knowledge of "Thinking Green" while strenthening their sorting and graphing skills as they complete this "What gets recycled" challenge. A great way to combine math and social studies.
Subjects:
Grades:
PreK - 4th
Interactive Anchor Charts-Grade 4 CCSS Fractions
NOW IN BLACK AND WHITE AND COLORED ANCHOR CHARTS!!Product DescriptionThese Interactive Anchor Charts/Notes are designed to help students learn to take notes about the different skills and procedures used in math. This product can be used alongside Modules of Engage New York or Zearn curriculum but are blank anchor charts based on the models found in CCSS, so it can be used to help reinforce CCSS 4th grade skills taught any way.What's Included- Anchor Charts with blank student interactive notes f
Subjects:
Grades:
3rd - 5th
Also included in: Interactive Anchor Charts- 4th Grade Bundle
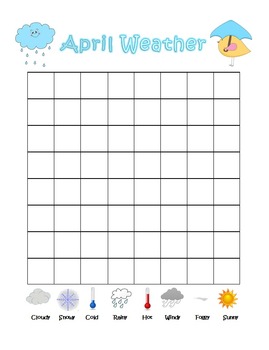
Monthly Weather Graph Charting ***BUNDLE***
This bundle includes weather graphs for September through June! Teach kids to graph using daily weather with these fun weather graphs! Graphics are tapered to monthly themes, they are great for grades K-5.
Subjects:
Grades:
K - 5th
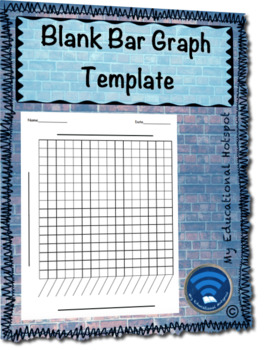
Blank Bar Graph Template
Check out this simple and organized template that has a labelled and specific sections for a bar graph. This outline is ideal for supporting students' understanding of graphing, for use with differentiation, or for modification for struggling students. Also, when used in science or social studies, when the lesson isn't on graphing, this can cut out a lot of wasted time. Presented in a simple and student-friendly way, the possibilities for implementation are endless!
Grades:
2nd - 10th
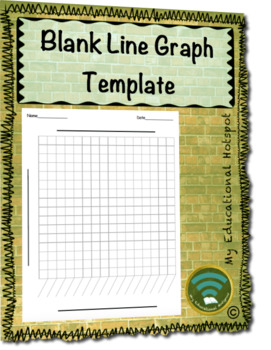
Blank Line Graph Template
Check out this simple and organized template that has a labelled and specific sections for a line graph. This outline is ideal for supporting students' understanding of graphing, for use with differentiation, or for modification for struggling students. Also, when used in science or social studies, when the lesson isn't on graphing, this can cut out a lot of wasted time. Presented in a simple and student-friendly way, the possibilities for implementation are endless!
Also, be sure to check out
Grades:
2nd - 10th
Types:
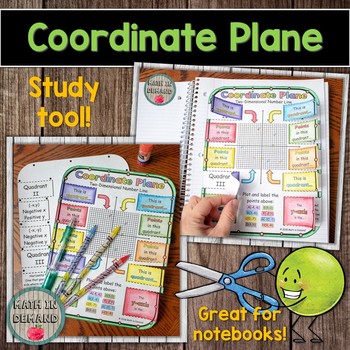
Coordinate Plane Foldable (Coordinate System Foldable)
Students will be constructing a foldable on the coordinate plane (coordinate system). There are 2 versions: (1) blank template and (2) answer key template. You can decide if you want students to fill out the foldable or give them the foldable with the answers already printed.This foldable looks great in interactive notebooks, but can also be a handheld study tool!
Grades:
4th - 6th
Also included in: Math Foldables Bundle (Includes All Math Wheel Foldables)
Digital GRADE 4 Data and Infographic Unit (New Ontario Curriculum)
Looking for a complete Data Unit for Grade 4 that is Digital??? This resource has 81 pages of Slides! Inside you will find everything you need to teach, assign and assess all of the expectations in Data Collection, Organization and Visualization. This unit is ready to roll. - review bar graphs, double bar graphs, pictographs, and stem and leaf plots- students learn to gather, display and analyse data and draw their own conclusions- learn the difference between qualitative and quantitative data-
Grades:
4th
Types:
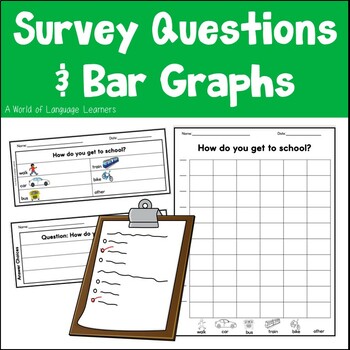
Survey Questions and Bar Graphs
Do you want to help your students collect data using a survey? Do they need to create a graph to represent the data that they have collected? This set of survey sheets and bar graphs include picture support for beginning readers and ELLs. There are also blank survey sheets and bar graphs included for students to add in their own original answers. The survey sheets are designed to be cut apart.**************************************************************************************************Addit
Subjects:
Grades:
1st - 4th
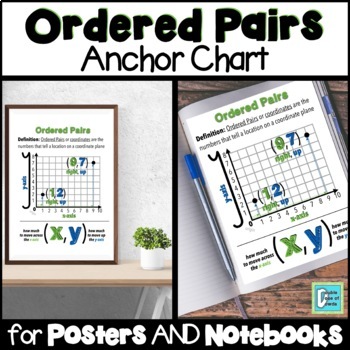
Ordered Pairs Anchor Chart for Interactive Notebooks and Posters
This anchor chart for ordered pairs will show your students how to plot points in quadrant 1 on the coordinate plane. We prefer to keep anchor charts simple and neat so as not to overwhelm our students and to keep them focused on essential information. This is a one-page anchor chart that comes in a variety of formats including a single sheet, half sheets (great for interactive notebooks), and a 2x2 POSTER. The poster will print on 4 sheets of paper which you will need to trim and tape to form
Grades:
4th - 6th
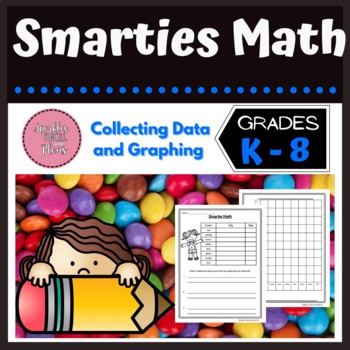
Smarties Graphing (Canada)
This is such an engaging way to practice data management! Use boxes of Smarties (or M&M's) and have kids practice tallying, graphing, and analyzing data. You could use the graphing section for pictographs or bar graphs. 3 different sizes of graphs are included.*This activity is designed for CANADIAN Smarties (the chocolate candy), not AMERICAN Smarties.Follow me on Instagram, Facebook, Pinterest, and follow my store on TPT! Thanks for purchasing! Don’t forget to leave feedback! When you
Subjects:
Grades:
1st - 4th
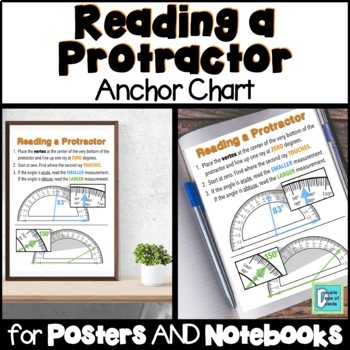
Reading a Protractor Anchor Chart Interactive Notebooks & Posters
This anchor chart for protractors shows students visual examples as well as step-by-step instructions on how to read a protractor. We prefer to keep anchor charts simple and neat so as not to overwhelm our students and to keep them focused on essential information. This is a one-page anchor chart that comes in a variety of formats including a single sheet, half sheets (great for interactive notebooks), and a 2x2 POSTER. The poster will print on 4 sheets of paper which you will need to trim and
Subjects:
Grades:
4th - 6th
CCSS:
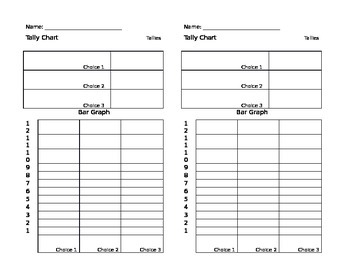
Blank Tally Chart and Graph Paper
This template is designed to let students graph just about anything. Students can start by choosing their own survey question, tallying the results, and making the bar graph.
Documents include 3, 4, and 5 choices for bar graphs. This is a very versatile document to help you with all your graphing needs!
Subjects:
Grades:
1st - 4th

Pattern Blocks with Angle Measures
This is a student resource quick guide displaying angle measures of pattern blocks. An easy resource to print, laminate and share with your students! This supports New York Common Core Mathematics Grade 4: Module 4, Lessons 10 and 11. In these lessons, students use pattern blocks to create angle measures of 90, 180, 270 and 360 degrees. This resource is also great for Math centers!
Subjects:
Grades:
3rd - 6th
CCSS:
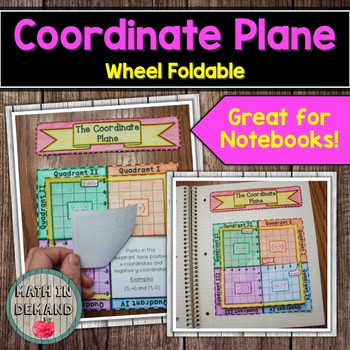
Coordinate Plane Wheel Foldable (The Coordinate System)
Students will be constructing a wheel foldable on the coordinate plane. This is a simple foldable that goes over the quadrants in the coordinate system. There are 3 versions: (1) Fill-in, (2) Blank, and (3) Answer Key.
Grades:
4th - 6th
Also included in: Math Foldables Bundle (Includes All Math Wheel Foldables)
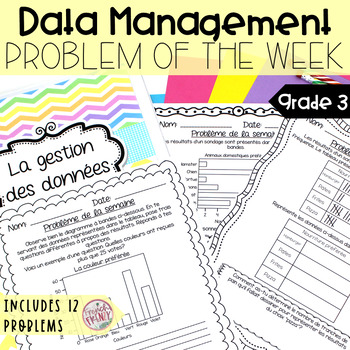
French Math Problem of the Week - Data Management GRADE 3 (Gestion des données)
THIS PACKAGE IS PART OF A BUNDLE THAT INCLUDES ALL 5 MATH STRANDS. SAVE 20% WITH THE BUNDLE. CLICK TO SEE A PREVIEW OF THE GRADE 3 PROBLEM OF THE WEEK BUNDLE.This specific French Problem of the Week package includes 12 Math word problems related to Data Management/Graphing (La gestion des données). Each problem includes a little graphic organizer to help students organize their information, ideas and calculations. The file also includes a cover page for the unit.The problem of the week is a grea
Subjects:
Grades:
3rd - 4th
Also included in: French Math Word Problems BUNDLE (Grade 3 - Problème de la semaine)
Showing 1-24 of 314 results


