19 results
8th grade statistics resources by TpT sellers for TpT sellers
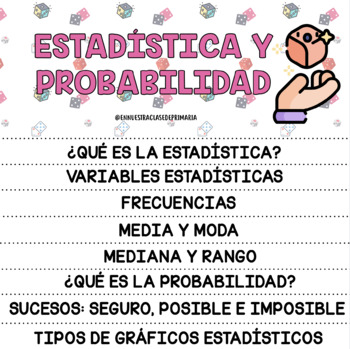
FLIPBOOK ESTADÍSTICA Y PROBABILIDAD
FLIPBOOK para trabajar los siguientes contenidos: ¿Qué es la estadística?Variables estadísticas.Frecuencias,Media y modaMediana y rango¿Qué es la probabilidad?Sucesos: seguro, posible e imposible. Tipos de gráficos.
Subjects:
Grades:
5th - 8th

Sequences and Series Worksheets Algebra 2
Series WorksheetsThis is a graphical preview of the Sequences and Series Worksheets. You can customize these worksheets by selecting various variables to meet your specific needs. Each worksheet is randomly generated, ensuring an endless supply of unique and high-quality materials for classroom or home use. Our collection includes general sequences, arithmetic sequences, geometric sequences, comparisons of arithmetic and geometric sequences, general series, arithmetic series, arithmetic and geom
Subjects:
Grades:
8th - 12th
Which Quarterback is the G.O.A.T.? - Using Statistical Calculations
Note: This is an upgraded version of the Statistical Analysis Using Football (QB) Stats. If you have previously purchased this resource please email me and I will send you the updated version.This project has students calculate percents, averages, and ratios, as well as create scatterplots, box and whisker plots, and histogram (bar graphs) based on their calculations.Google slideshow includes 12 well know Hall of Fame quarterbacks including Joe Namath, Roger Staubach, Terry Bradshaw, Joe Montana
Subjects:
Grades:
6th - 9th
CCSS:
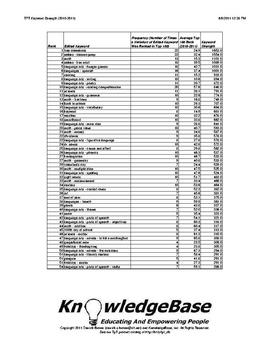
TPT KeyWord Strength Index (2010-2011) - Downloadable Spreadsheet!
What are the strongest keywords on TpT?
1. free downloads
2. Deanna Jump
3. math
Neither #1 nor #2 are surprises, but #3 (math) was certainly a surprise to me!
This report analyzes TpT's 2010-2011 keywords using a measure called "keyword strength".
The measure is based on a keyword's average rank, as well as the number of times it appeared in the 2010-2011 "Top 100" TpT search engine rankings.
This can be a valuable tool to help sellers understand TpT's marketplace supply and demand!
The P
Subjects:
Grades:
PreK - 12th, Higher Education, Adult Education, Staff
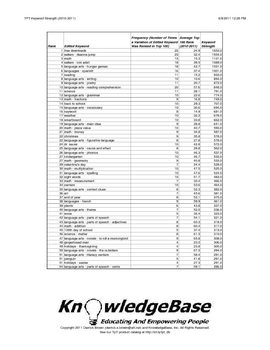
TPT KeyWord Strength Index (2010-2011) - Downloadable PDF!
What are the strongest keywords on TpT?
1. free downloads
2. Deanna Jump
3. math
Neither #1 nor #2 are surprises, but #3 (math) was certainly a surprise to me!
This report analyzes TpT's 2010-2011 keywords using a measure called "keyword strength".
The measure is based on a keyword's average rank, as well as the number of times it appeared in the 2010-2011 "Top 100" TpT search engine rankings.
This can be a valuable tool to help sellers understand TpT's marketplace supply and demand!
The P
Subjects:
Grades:
PreK - 12th, Higher Education, Adult Education, Staff
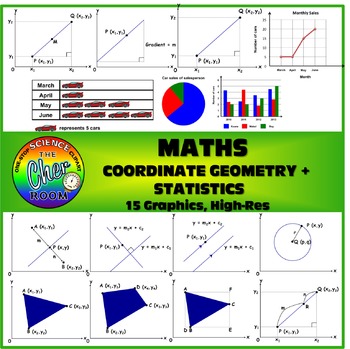
MATH Clipart: Coordinate Geometry and Statistics
15 Graphics on Coordinate Geometry and Statistics
You'll find diagrams that illustrates the following:
Gradient
Mid Point
Point at a ratio
Area of geometry
pi chart
pictogram
bar chart
line graph
This product is allowed for both personal and commercial use, but credit must be given to my store: https://www.teacherspayteachers.com/Store/The-Cher-Room
Subjects:
Grades:
7th - 12th
Dice Bulletin Board Letters
These dice themed alphabet letter will brighten up your bulletin board display. All 26 alphabet letters are included in an uppercase font, as well as numerals 0-9 and punctuation. Letters are approximately 6 inches tall. Just print what you need and enjoy. Be sure to check out my other fun, themed letters in my store.
Subjects:
Grades:
PreK - 12th, Higher Education, Adult Education, Staff
Statistics Vocabulary TEKS Aligned
This product includes several vocabulary words for a statistics unit. There are three graphs that will be able to cut and match, along with definitions of vocabulary words.
This is aligned with the Texas TEKS
6.12B 6.12C 6.12D 6.13B
I hope this can be useful to you and your students!
Stop by my store for some free fonts!
S&S Designs
https//www.teacherspayteachers.com/Store/S-And-S-Designs
Subjects:
Grades:
6th - 9th

MedAware Labels and Chart Kit Booklet
Always Know When, What, Why and How Medications are taken.
(Avoid under and overdosing prescription, generic and other drugs).
Subjects:
Grades:
PreK - 12th, Higher Education, Adult Education, Staff

Comparing Bi-Variate Data Common Core 8th Grade Scatterplot Activity
Students analyze their athletic ability and their grade point average versus how old they are relative to their classmates. Students are assigned numbers so that their is still privacy within students. Students collect and analyze data to make decisions based off of bivariate data.
Subjects:
Grades:
7th - 8th
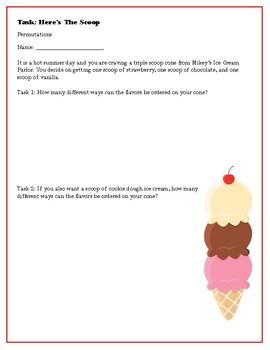
Permutation Task: Here's the Scoop
Use this task to teach about permutations. It is fun and will lead to a great discussion on different methods to deal with ordering a set of items.
Subjects:
Grades:
3rd - 8th
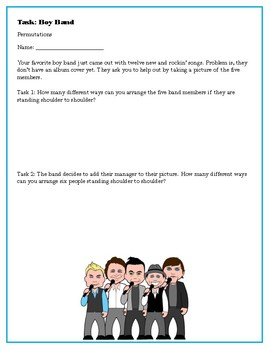
Permutation Task: Boy Band
Use this task to teach about permutations. It is fun and will lead to a great discussion on different methods to deal with ordering a set of items.
Subjects:
Grades:
4th - 8th
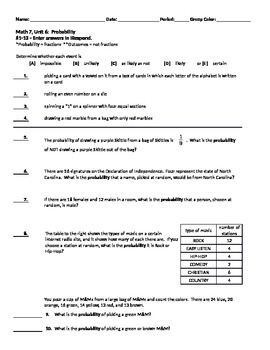
Probabilitiy Summative Test
Assesses Fundamental Counting Principle, Tree Diagrams, Independent & Dependent Events, and likelihood. Part One of the test is also iRespond/Promethean remote ready with multiple choice and numeric answers.
Subjects:
Grades:
6th - 9th

Expected Value Activity Involving Cereal Boxes Common Core
Students analyze a classic cereal box toy problem. The students are presented with a scenario about a collection of six toys in a cereal boxes and how long it would take to get each toy. Students simulate the experience by conducting an experiment in class.
Subjects:
Grades:
7th - 12th
CCSS:

Analyzing Combinations with Rock, Paper, Scissors Common Core
Students use the classic game Rock, Paper, Scissors to analyze combinations and sample size. Also investigate basic probability.
Subjects:
Grades:
6th - 8th

Box and Whisker Plot Comparison Common Core Analyze and Interpret Data
Students will compare the calories from chicken and hamburger sandwiches from fast food chains and then determine what is the healthier food choice based on analyzing their data.
Subjects:
Grades:
6th - 8th

Peanut Butter Challenge Common Core interpreting data analyze data
Students learn to collect, represent, and analyze data. Students participate in a taste testing challenge between two types of peanut butter and collect data within their class. They learn to represent and analyze the data from that point.
Subjects:
Grades:
6th - 8th

Middle School Math Sampling Common Core Project
A sampling project for your middle school students. Have the students investigate various forms of sampling (systematic, voluntary-response, convenience and random). Allows for student creativity and for analysis about survey bias. Rubric including for scoring.
Subjects:
Grades:
5th - 8th
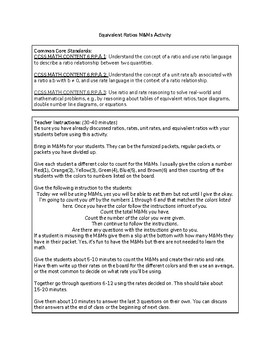
M&M Equivalent Ratios Activity
This is a good activity for students to help them understand equivalent ratios. Having them count the M&Ms given to find equivalent ratios based off of the ratios decided on as a class. Really good for when you first start learning about ratios.
Subjects:
Grades:
6th - 8th
Showing 1-19 of 19 results


