57 results
High school statistics centers for Google Apps
Data Analysis and Statistics in Algebra 1 Google Forms Homework and Assessment
This Algebra 1 Google Forms bundle currently includes auto-grading assignments on the following skills related to data analysis and statistics:Measures of Central TendencyDot Plots and HistogramsBox PlotsStandard Deviation and The Empirical RuleTwo-Way Frequency TablesScatter PlotsEach assignment also includes a PDF "worksheet" for students to complete along with the form.All of the assignments in this bundle are also included in my:★ Algebra 1 (Semester 2) Google Forms BundleYou may also be int
Subjects:
Grades:
6th - 9th
CCSS:
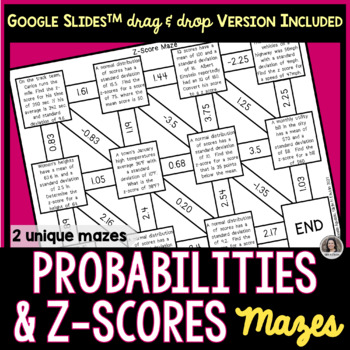
Z Scores and Probabilities of Normal Distributions Mazes Google Slides™ & Print
Make practicing math more fun with these 2 different mazes on finding z-scores and probabilities of normal distributions. For each self correcting maze activity, students will solve at least 9 problems. Types of Mazes*Finding Z-Score from a Word Problem Maze #1*Finding Probabilities or X-Values Given the Z-Score Maze #2Students may complete their work on the provided student response sheet that corresponds to the maze assigned. Note: Not all boxes are used. Included:TWO unique MazesA pdf with a
Subjects:
Grades:
6th - 12th, Higher Education
Types:
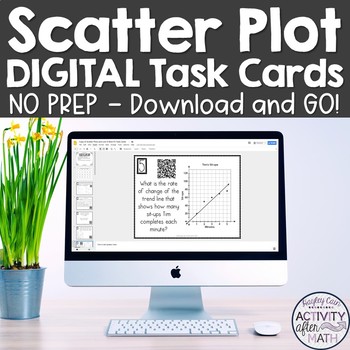
Scatter Plots Line of Best Fit Digital Task Cards Distance Learning
GOOGLE Slide Version Get your students involved with practicing Interpreting Data with Scatter Plots and Line of Best Fit! Task cards include multiple choice problems and constructed response. This is a great activity that can be used for distance learning and review in math centers, as individual work, or as a group activity! This integrates the use of technology into the classroom by allowing students to use their phone, tablets, laptops, and desktops to view the task card and by being able to
Subjects:
Grades:
8th - 9th
Types:
Also included in: 8th Grade Math DIGITAL TASK CARDS BUNDLE Google Slides
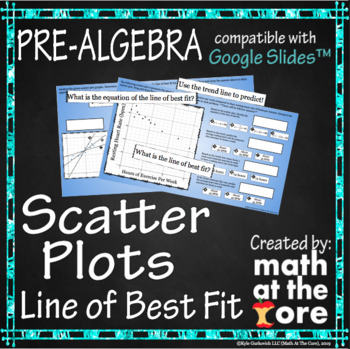
Scatter Plots - Line of Best Fit for Google Slides™
- Great for online and distance learning! Created to be compatible with Google Slides™!- In this digital activity, students will analyze scatter plots and determine the line of best fit. They will use the line of best fit and the equation of that line to predict values. They should be familiar with writing the equation of a line.- This activity includes 20 different problems involving analyzing scatter plots. Students will start with determining which line is the line of best fit for the given s
Subjects:
Grades:
7th - 9th
Types:
Also included in: Statistics - Unit 7 - BUNDLE for Google Slides™
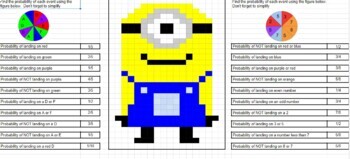
Digital learning Simple Probability Pixel Art (Minions)
This 20 question pixel art activity is designed to help your students master the basic skill of simple probability and it's compliment. Allow the students to have fun with this pixel art activity in which if the student gets the answer correct then parts of the image will appear. If the student is incorrect then no parts of the image will appear.
Subjects:
Grades:
7th - 12th
Types:
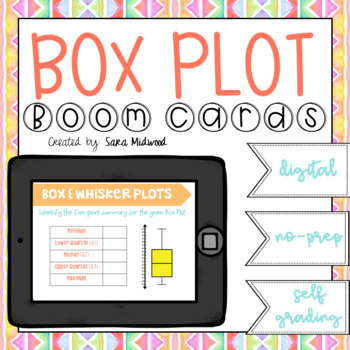
Box Plots Boom Cards | Distance Learning
Practice the skills of Box Plots (box and whisker plots) with these engaging and interactive Boom Cards. Let Boom collect all of your data to assess student progress. This will be fun for you students and easy for you! They will love these interactive task cards!Included in deck: 20 cards working on reading and creating box plots (box and whisker plots). -8 cards work on identifying the five-point summary of a box plot-4 cards have students to identify the Interquartile range of a box plot-4 car
Subjects:
Grades:
5th - 9th
Types:
Also included in: 6th grade Math skills Boom Cards | Distance Learning
Counting Principle & Permutation Task Cards (Digital/PDF)
This download includes both a PDF and digital Google Forms version of this activity.Do you need more questions to use to provide practice with the counting principle and/or permutations? Here you go!These 36 task cards focus on using the counting principle and calculating permutations. Both color and black/white copies are included. Copy them onto cardstock and/or laminate them to create a long-lasting, reusable resource. Use a few at a time for focused practice or mix them together … your c
Subjects:
Grades:
7th - 12th
Types:
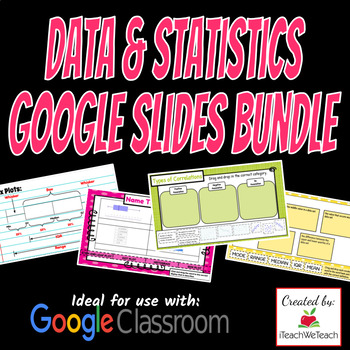
Statistics Bundle | Google Slides Activities | Download & Go!
The bundle includes:Measures of Center and Spread Google Slides ActivityCreating and Interpreting Box Plots Google Slides ActivityDisplaying Data Google Slides ActivityScatter Plots Google Slides ActivityTopics Include: mean, median, mode, range, maximum, minimum, measures of center, measures of spread, dot plots, box-and-whisker plots, histograms, and more.These activities are ideal for use with Google Classroom, but can be shared as a link on virtual classroom websites like Canvas, Schoology,
Subjects:
Grades:
6th - 9th
Types:
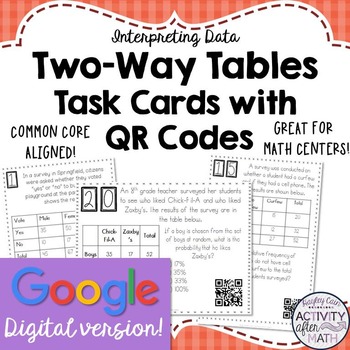
Two-Way Tables (Interpreting Data) Task Cards GOOGLE Slide Distance Learning
GOOGLE SLIDE VERSION Get your students involved with practicing Interpreting Data with Two-Way Tables! Students will have to read two-way tables to calculate relative frequencies. This is a great activity that can be used for distance learning and review in math centers, as individual work, or as a group activity! This integrates the use of technology into the classroom by allowing students to use their phone, tablets, laptops, and desktops to view the task card and by being able to scan the QR
Subjects:
Grades:
8th - 9th
Types:
CCSS:
Also included in: 8th Grade Math DIGITAL TASK CARDS BUNDLE Google Slides
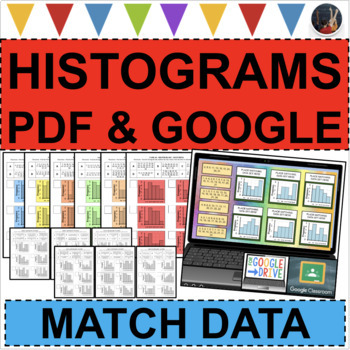
HISTOGRAMS Matching Data Sets Displays Investigations Stations PDF & GOOGLE
IGNITE your students enthusiasm for HISTOGRAMS and Statistical Displays with this ASSIGNMENT! INTERACTIVE and ENGAGING! Develop deep understanding for students using these stations to strengthen their skills for analyzing graphs.You will receive both the PDF and GOOGLE SLIDES versions of this assignment to meet your specific classroom needs (in-person, hybrid, virtual, etc.)These differentiated activities are NO PREP and READY TO GO! Great for sub (substitute lesson plans). They work well as
Subjects:
Grades:
6th - 9th
Types:
Independent and Dependent Probability Task Cards (Digital/PDF)
This download includes both a PDF and digital Google Forms version of this activity.If you're like me, you can never find enough practice problems for this topic so I've created these task cards. I hope they help you out as well!Students will determine the probabilities of independent and dependent events.These 36 task cards provide a good variety of problems for students.An answer key is included.
Subjects:
Grades:
7th - 11th
Types:
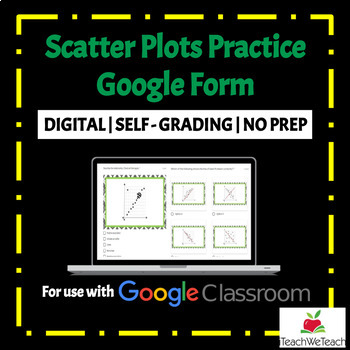
Scatter Plots | Google Forms Activity
★ DIGITAL Math Resource★ Are you looking for quality, standards aligned math resources to use with Google Classroom™? This resource is a fun and engaging way for students for practice solving problems involving scatter plots. This product includes a Google Form with 20 questions about scatter plots. Problems cover correlation type, the line of best fit and predicting scatter plot values. Possible Uses:• Practice• Homework • Assessment• ReteachCheck out my other products HERE.Please review my ter
Subjects:
Grades:
7th - 12th
Types:
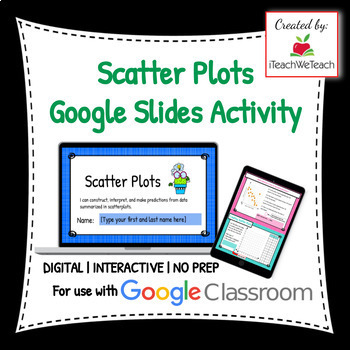
Scatter Plots Google Slides Activity | Interactive | No Prep | Download and Go!
★ DIGITAL Math Resource★ Are you looking for quality, standards aligned math resources to use with Google Classroom™? This resource is a fun and engaging way for students for practice solving problems involving scatter plots. This product includes a Google Slides activity with 19 interactive slides with questions about scatter plots. Problems cover correlation type, the line of best fit and predicting scatter plot values.To get the complete resource --> CLICK HERE!Possible UsesLesson & pr
Subjects:
Grades:
7th - 10th
Types:
Also included in: Statistics Bundle | Google Slides Activities | Download & Go!
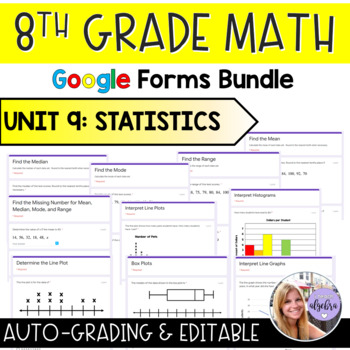
Grade 8 Math Google Forms - Unit 9: Statistics
This is a collection of Google Forms designed to be used through the Google Classroom platform. These forms are perfect for in-class practice, homework assignments, or even as mini quizzes!All of the Google Forms are currently set to be:auto-gradedshow progressallow one answershow results when submittedbut all of these features can of course be adjusted and set to your needs. You can also always edit, remove, or add any problems.Unit 9: Statistics:Interpret Line Plots (10 short answer)Determi
Subjects:
Grades:
6th - 9th
Also included in: Grade 8 Math Google Forms - Bundle for the Entire School Year
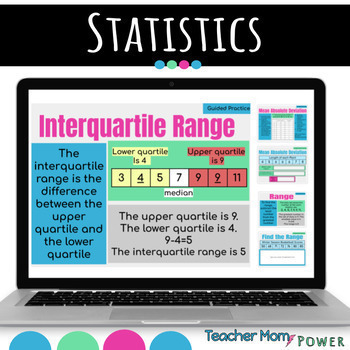
Statistics Digital Unit: Math Stats Lesson & Activities {Google Slides}
Digital Statistics UnitThis Digital Resource can be used as-Google SlidesGoogle Classroom AssignmentAdd to Google DriveUse a PowerPointAssign via other digital meansUsage Suggestions and IdeasThis resource can be utilized in numerous ways, here are some ideas:use for guided practiceassign as partner workassign as independent practicecan be used for morning workuse for reteaching in small group settinguse as review prior to assessmentuse as review in continuing to strengthen skillassign for homew
Subjects:
Grades:
4th - 9th
Types:
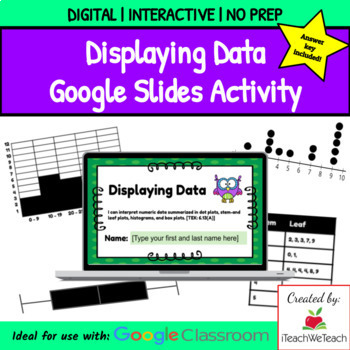
Interpreting Data Displays | Google Slides | Distance Learning | No Prep
★ DIGITAL Math Resource★ Are you looking for quality, standards aligned math resources to use with Google Classroom™? This resource is a fun and engaging way for students for review creating and interpreting data displays. It includes vocabulary and lots of practice.Possible Uses:Lesson & PracticeSummer EnrichmentHome SchoolInterventionHomeworkReteachDistance LeanringIf you haven’t already created a free Google account for yourself and your student(s) (or a Google Classroom account), you wil
Subjects:
Grades:
6th - 12th
Types:
Also included in: Statistics Bundle | Google Slides Activities | Download & Go!
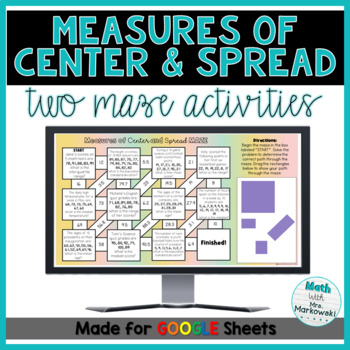
Statistics: Measures of Center & Spread - TWO Digital Maze Options
Students will calculate various measures of center and spread by completing either a digital drag and drop maze in Google Slides OR a self-checking maze in Google Sheets. The drag and drop maze is helpful because it gives the students choices. The self-checking maze does not give choices and can be used for differentiating. Students will know if they are right or wrong after typing their answer. If the answer is correct, the answer box will turn green and a path will appear leading to the ne
Subjects:
Grades:
6th - 9th
Types:
CCSS:
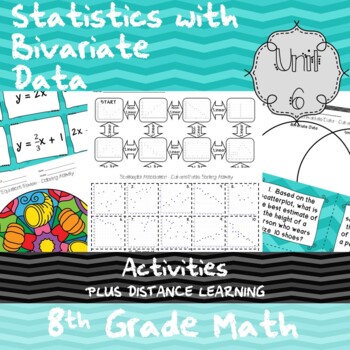
Statistics with Bivariate Data - Unit 6 - 8th Grade- Activities + Distance Learn
This bundle contains just the Activities included in my Unit 6 - 8th Grade Math - Curriculum.THIS FILE NOW CONTAINS THE PDF VERSION OF THIS PRODUCT PLUS A GOOGLE SLIDES VERSION FOR DISTANCE LEARNING7 Activities and Games that cover:• Solving Equation Review • Writing Equations in Slope-Intercept Form• Writing Equations from a Verbal Statement• Comparing and Contrasting Bivariate and Univariate Data• Linear and Non-Linear Bivariate Data• Trend Lines• Trend Lines and Correlations• Scatterplots and
Subjects:
Grades:
7th - 9th
Types:
Also included in: Statistics with Bivariate Data - Unit 6 - 8th Grade + Distance Learning
The Two Day Basketball Math Project, GOOGLE DOC VERSION
The Two Day Basketball Math Project is exactly like it sounds. It was designed for an advanced middle school or early high school student (preferably a basketball fan) to complete in about two days and contains quite a bit of rigor for something that the student will think is a fun change of pace. It's not a project that requires any pre-planning or supplies. It's just a great project that is a bit all-encompassing as far as math skills are concerned. They will learn how some basketball stat
Subjects:
Grades:
6th - 12th
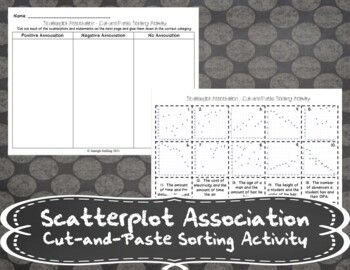
Scatterplot Association Cut and Paste Sorting Activity + Distance Learning
Scatterplot Association Cut and Paste Sorting ActivityTHIS FILE NOW CONTAINS THE PDF VERSION OF THIS PRODUCT PLUS A GOOGLE SLIDES VERSION FOR DISTANCE LEARNINGIn this activity, students will sort the scatterplots and statements into either the positive association group, negative association group, or no association group.This product can be used as a cut-and-paste or fill-in-the-blank document depending on the time you have during a class period.A printable answer key is included.Terms of Use©
Subjects:
Grades:
7th - 9th
Types:
Also included in: Application of Linear Functions - Unit 4 - Algebra 1 - Activities
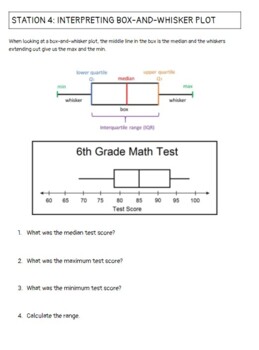
Applied Statistics End of Year Review Stations
A set of 10 stations to help students practice interpreting bar graphs, stem-and-leaf plots, and box-and-whisker plots. Also, works with finding the mean, median, mode, and range. Finally, have probability and normal distribution questions.
Subjects:
Grades:
7th - 12th
Types:
CCSS:
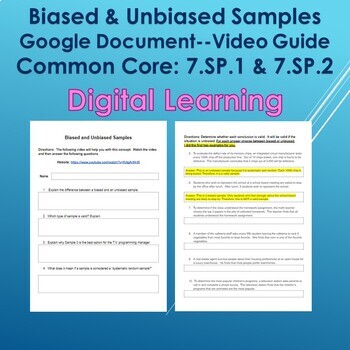
Unbiased and Biased Samples--Google Document--Distance Learning
This resource includes a video guide for Unbiased and Biased Samples. This lesson will go well with Glencoe Course 2 Lesson 10-2. This lesson explains the difference between unbiased and biased samples and gives students practice on deciding between the two. I have included the answers for the students to the first example questions. This resource includes a Google Document. This would be a great activity for Test Preparation
Subjects:
Grades:
7th - 10th
Types:
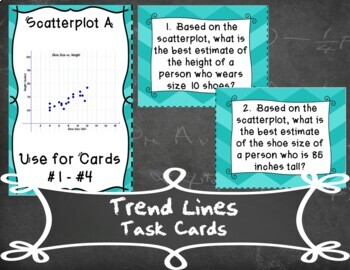
Trend Lines Task Cards + Distance Learning
Trend Lines Task CardsTHIS FILE NOW CONTAINS THE PDF VERSION OF THIS PRODUCT PLUS A GOOGLE SLIDES VERSION FOR DISTANCE LEARNINGThese 16 task cards require students to answer questions about scatterplots using a trend lineAn answer document is included and allows students to work in any order. A printable answer key is also included.Terms of Use© Janeigh Stalling 2015 - 2020By purchasing this product, the purchaser receives a limited individual license to reproduce the product for individual sing
Subjects:
Grades:
7th - 9th
Types:
Also included in: Application of Linear Functions - Unit 4 - Algebra 1 - Activities
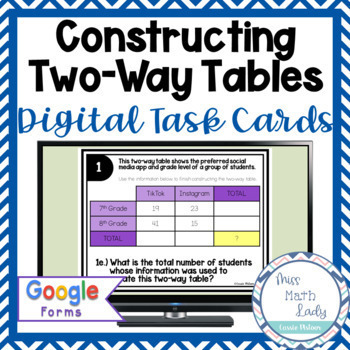
Constructing Two-Way Tables Digital Task Cards GOOGLE Form
Students will complete the construction of 4 different two-way tables by entering the missing values as short answer responses in this self-grading Google Forms assignment. Students will use their knowledge of two-way frequency tables to add or subtract values given in a table or word problem to answer the 16 questions. Students are given an opportunity to upload a file (such as a photo of their handwritten work) at the end of the assignment to show how they got each of their answers.This intera
Subjects:
Grades:
7th - 9th
Types:
CCSS:
Showing 1-24 of 57 results


