23 results
Statistics cultural activities
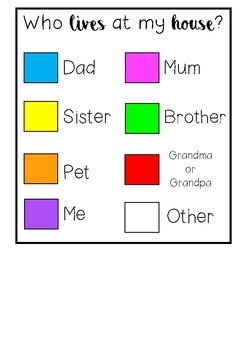
Who Lives at Your House? Data Collection Craft!
This is a gorgeous crafty activity for young children to display the data in their homes (people who live with them). It's easy and makes for a beautiful classroom display. This is a great activity to do for cultural or diversity awareness or otherwise a statistics and data collection lesson.
This resource includes one PDF file with a house template, a title banner and the 'data key' for the display.
The only thing not included is the coloured paper squares for the craft. Any coloured paper wi
Subjects:
Grades:
PreK - 4th

Fun Statistics Research Survey Project | Standards-Based | Math 9 BC
This is a great math project to add to a unit on data and statistics. It is a great way for students to do a project on something that is important to them and they get a chance to present their individual work, which is rewarding.Description:Tell students they will be conducting a survey on. They should pick a topic and question that has some significance to them, their family, or their culture. Students will:Write a research question and a prediction. Describe the population, sampling techni
Subjects:
Grades:
7th - 11th
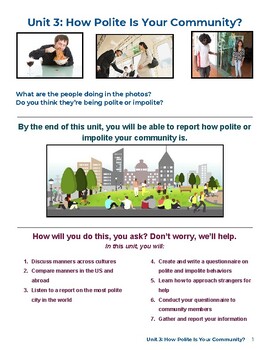
Project-based Unit on Polite/Impolite Behaviors
This project-based unit on polite behaviors is an engaging and interactive way for ESL students to build their communication skills. Other skills and systems are targeted in the unit, such as reading to make predictions and writing a hypothesis. Depending on the dynamics of the class and instructor, this unit can be completed in 1-2 weeks.Although students are expected to conduct surveys in public and present their findings, the tasks can be adapted to suit the class's comfort zones and needs. F
Grades:
9th - 12th, Higher Education, Adult Education
Types:
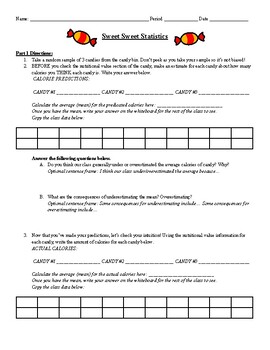
Halloween / Fall Statistics Class Activity for Box Plots and Five Number Summary
Hello!If you're looking for a fun and engaging activity for your Statistics Class this Halloween or fall season, this activity is great! My students enjoy getting the opportunity to eat candy as they work on some real-world statistical applications. The activity requires students to collect data, share data with their peers, and analyze the data. They will be working on creating a five number summary and analyzing/drawing box plots. You will need to purchase candy for this activity. Please reach
Subjects:
Grades:
9th - 12th, Higher Education
CCSS:
White Supremacy and Confederate Monuments Timeline Activity
This is an activity that uses data collected by the Southern Poverty Law Center tracking the use of Confederate symbols in the form of monuments, courthouses, schools, and other public amenities, including parks, highways and holidays.
The activity takes place in 3 parts:
The first part is that students assemble and label a timeline that tracks the rise of Confederate symbols from 1860 to the present day (2016.)
In the second part, students match dates to 10 different events in Civil Rights h
Subjects:
Grades:
5th - 12th

Social Justice in Math BUNDLE--NEW
Here are SIX middle school worksheets that incorporate the concepts of social justice. Teachers can model equality and equity while doing math. Here is a way to get started! NEW WORKSHEETS ADDED! (each worksheet is also available individually).
Subjects:
Grades:
6th - 10th
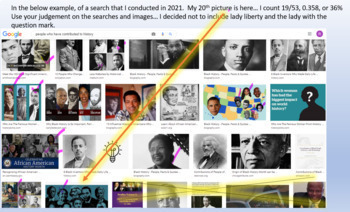
Women's History Month Probability Project
Students learn about suffrage and representatio of women. Students conduct Google searches on favorite subject, sport/hobby, future career and find the probability of a woman appearing in the first 20 images. Students make conjectures about representation of women in those areas. Students identify women they admire and create a video summarizing their findings.Can be adapted to images for African Americans for Black History Month, Hispanic Americans for Hispanic Heritage Month, etc.
Subjects:
Grades:
6th - 12th, Adult Education, Staff
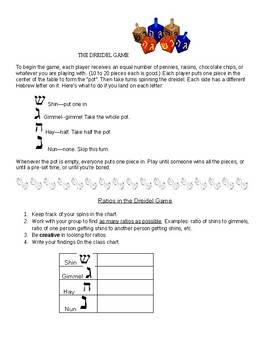
Dreidel Game for Fun and Ratios
Here is a great way to practice ratios, have fun and learn about another culture. Great to use at Hanukkah time or any time of the year. This worksheet and class chart teaches the students how to play dreidel and then instructs them to practice finding and writing ratios as they play. Dreidels are available inexpensively on the internet, and you only need one per group of students.
Grades:
5th - 8th
Probability Scavenger Hunt (with a Finale about Activist Medgar Evers)
Students will love getting out of their seats to solve problems related to permutations and probabilities of independent and dependent events! The self-checking nature of this scavenger hunt makes it super-easy to run this activity and to tell if students understand the content. You don't have to do any work - just print the signs and hang them. The student solution sheet includes an interesting historical application related to Medgar Evers - students will determine the probability of his m
Subjects:
Grades:
6th - 12th
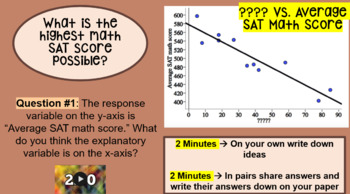
Stats: Inequities in Student Achievement & Poverty (PPT, NOTE SHEET-KEY, CFU)
Empower students to be able to interpret relevant data and make informed decisions based upon that data.Activity Based Learning where students experience first and then formalize their thoughts later.Extremely relevantMath discourse- a lot of room for conversation and critical thinkingProblem solving, reasoning, representation, communication, and connections … Oh my!When and Whereo Pre-Algebra/Algebra 1/Algebra 2: Linear Functions and Equationso Data and Statistics: Analyzing Two-Variable Datao
Subjects:
Grades:
9th - 12th
CCSS:
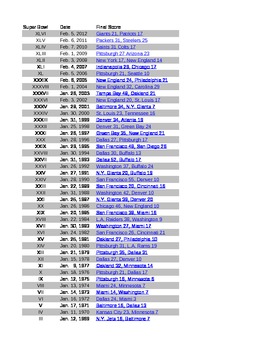
Is there a Correlation or Causation to football Scores
What does it really take to win a Super Bowl? During this activity you will explore the statistics behind winning and losing the game. make predictions and explain your data. correlation, causation, linear regression
Subjects:
Grades:
9th - 12th, Higher Education, Adult Education, Staff
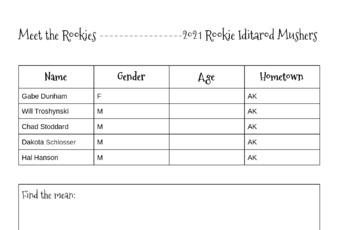
Iditarod Mean, Median, Mode, and Range
I made this mini-lesson to pre-teach mean, median, mode and range to students while their ELA class focused on a book study around the Iditarod. Students will use the Iditarod website to find the ages of the rookies who have their ages on the website. They will then find the mean, median, mode and range of those ages!**Please leave a review and check out my store for more!**
Subjects:
Grades:
4th - 7th
CCSS:
Social Justice in Middle School Math #3
This is the third worksheet of word problems for middle school math that highlight some of the social justice issues that are being addressed around the country. This particular worksheet is predominantly percent and proportion problems. See my two previous worksheets for other math topics. Math teachers should not and cannot stand by and let Social Studies and ELA teachers discuss social justice. Students should hear the facts from all teachers, and be educated so that each student can form his
Subjects:
Grades:
6th - 10th
Also included in: Social Justice in Math BUNDLE--NEW
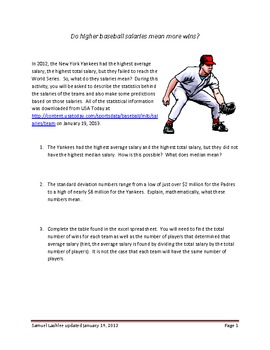
The Statistics of Baseball Salaries 2012
The statistics behind the salaries of the teams and also make some predictions based on those salaries. New York Yankees Philadelphia Phillies Boston Red Sox Los Angeles Angels Detroit Tigers Texas Rangers Miami Marlins San Francisco Giants St. Louis Cardinals Milwaukee Brewers White Los Angeles Dodgers Minnesota Twins Mets Chicago Cubs Atlanta Braves Cincinnati Reds Seattle Mariners Baltimore Orioles Washington Nationals Cleveland Indians Colorado Rockies Toronto Blue Jays Arizona Diamondbacks
Subjects:
Grades:
8th - 12th, Higher Education, Adult Education, Staff
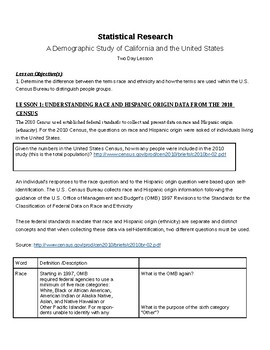
Statistical Analysis: U.S. Census Data Overview
This lesson uses data from the 2010 U.S. Census to allow students to access numbers and data in a social science classroom. The lesson is a 2 day mini-unit centered on working with charts, graphs, and tables (serves extremely well for SAT and ACT prep). This cross-curricular lesson draws meaningful parallels between math and social science, and the necessity of bringing these subjects together. The lesson uses a comparative look at Census data for California and the United States as a whole, but
Subjects:
Grades:
9th - 12th, Higher Education
Types:
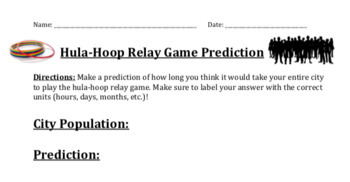
Equation of Line of Best Fit Activity (Hula-Hoop Relay Game)
This activity involves playing the hula-hoop relay game as a class to collect data. (You can find videos on youtube for demo/instructions of the game!) Students will use this data to predict how long they think it will take their town to play the game.The game:****You will need 1 hula-hoop to play this game!! (I got mine at the dollar store)****Students will start in a group of 3 and play the game, and someone will record the time it takes to play. Next, you will add another student to the group
Subjects:
Grades:
6th - 9th
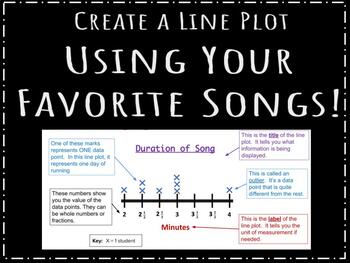
Fun Line Plot Assignment! (Minimal Prep)
Have students create a line plot using the time duration of their favorite songs! This is a great way for students to master learning the different parts of a line plot while also allowing them to "put a piece of themselves" in it! If students do not listen to music, they can use the current Top 10 most popular hits.Includes:- Slides to present to your students- Student handout for the activity
Subjects:
Grades:
5th - 7th
CCSS:
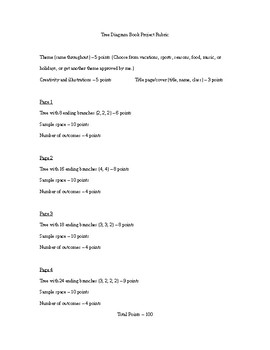
Tree Diagram Book Rubric
Students choose a broad topic and make 4 pages of tree diagrams with number of outcomes and sample spaces based on more specific parts of the broad topic. For example, students can choose Seasons as the broad topic and a different season for each page, or they can choose Types of Foods as the broad topic and a different type of food for each page. The categories and choices break down the topic into even more specific parts, and the choices make up the sets of branches in the tree.
Subjects:
Grades:
9th - 12th
Types:
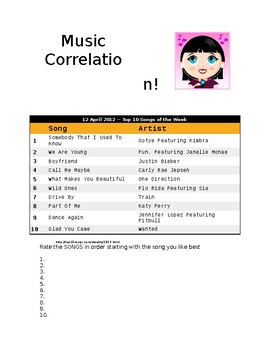
Music Correlation
Students rate the Top 10 songs and partner up. They plot their ratings and their partners' ratings and check for positive, negative, or no correlation. This can be adapted to any 10 songs of any genre.
Subjects:
Grades:
6th - 12th
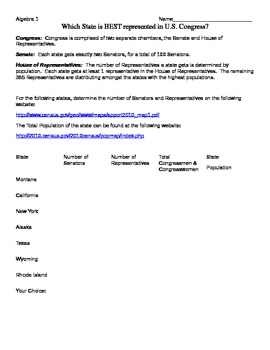
US Congress Ratios
This activity examines how each state is represented in the House of Representatives, Senate and Congress overall. Students examine what a low ratio of population to representatives means and what a high ratio of population to representatives means. Which states have the "best representation" and which states have the "worst representation".
Subjects:
Grades:
8th - 12th
Types:
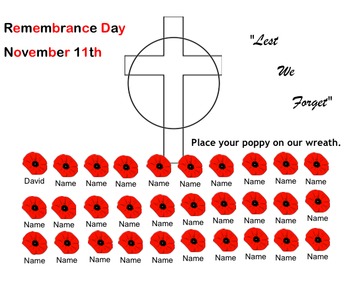
Remembrance Day Morning Activities for All Grades
This notebook is designed to aid teachers in the morning of Remembrance Day.
There are is a copy of Flanders Field. - Potential for Fluency Activity
Infographic on Remembrance Day - Potential for Numeracy/Literacy Discussion
Commercial from Bell - Potential Media Literacy Discussion
The Poppy Story for K-4 - General Knowledge
The Poppy Story for 5-8 - General Knowledge
With exception of the attendance, all are resources that I have used are not mine. The authors of these resources are to be c
Subjects:
Grades:
K - 8th
Types:

Scientific Math Minds
A math based science experiment outline in power point form. The slides guide students in selecting a question based on the population of their school for a social science project. Data collection and organization as well as sample surveys and scientific method is represented.
Subjects:
Grades:
4th - 6th
Types:
1:13
Patty Fernandez You Tube Channel Video Art Resources!
An entertaining stop motion / claymation video that lists the past 2 years of ART Lessons on myYou Tube Channel : Patty Fernandez ArtistVisit my You Tube Channel: Patty Fernandez Artist for over 1,000 videos that integrates the Visual Arts with other content areas you teach in a school day.Share my You Tube Channel: Patty Fernandez Artistwith your friends, school, and District.
Subjects:
Grades:
Not Grade Specific
Showing 1-23 of 23 results


