8 results
1st grade statistics resources for Easel
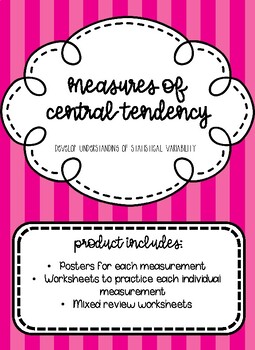
Finding Mean, Median, Mode, and Range
Simple worksheets (5 problems each) to introduce and practice finding the mean, median, mode, and range of a data set. Have students complete with or without calculator, depending on their instructional level. Product includes:-Reference posters for mean, median, mode, and range. Each poster includes the measures' definitions and directions for how to find them with an example.-5 worksheets about finding the mean.-5 worksheets about finding the median.-5 worksheets about finding the mode.-5 work
Subjects:
Grades:
1st - 12th
Types:
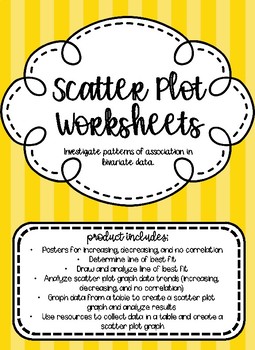
Scatter Plot Graph Worksheets
A collection of worksheets to use when teaching how to investigate patterns of association in bivariate data. Product includes 3 posters for students to reference how to determine if data is increasing, decreasing, or has no correlation. Types of worksheets include:
-Determine line of best fit
-Draw and analyze line of best fit
-Analyze scatter plot graph data trends (increasing, decreasing, and no correlation)
-Graph data from a table to create a scatter plot graph and analyze results
-Use reso
Subjects:
Grades:
1st - 12th
Types:
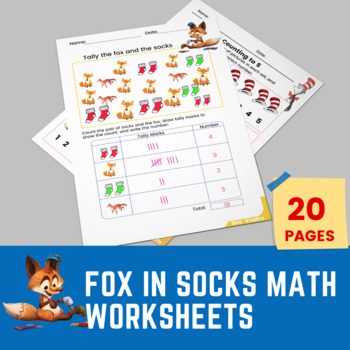
Fox in Socks Math Activity Tally Chart Worksheet
Fox in Socks Math Activity Tally Chart WorksheetFox in Socks is a fun math activity perfect for a Dr. Seuss theme with your 1st grade, 2nd grade, and Kindergarten class, but it can also be used any time of year during math centers. Print and laminate the counting to 5 cards and use as many times as you like with your Prek children. Worksheets also provide suitable activities for second grade kids to count the number of colorful socks and fox; cats and hats, blocks and clocks, and socks that are
Subjects:
Grades:
K - 2nd
Types:
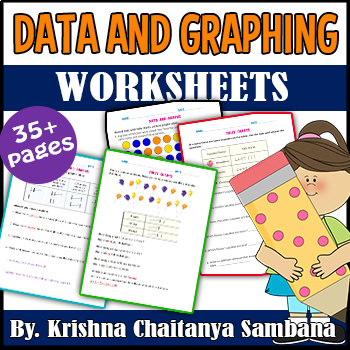
Data and Graphing Worksheets - Bar Graphs, Picture Graphs & Tally Charts
Data and graphing can be represented using various methods, including bar graphs, picture graphs, and tally charts:Bar Graphs: Bar graphs use rectangular bars of different lengths or heights to represent data. Each bar represents a category or item, and the height or length of the bar corresponds to the quantity or value of that category. Bar graphs are useful for comparing different categories or tracking changes over time.Picture Graphs: Picture graphs, also known as pictographs, use pictures
Subjects:
Grades:
K - 2nd
Types:
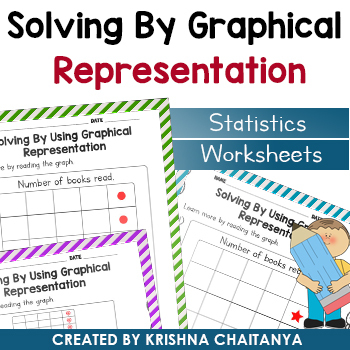
Solving By Graphical Representation
Graphical representation can be introduced to grade 1 students as a visual way to represent and compare numbers. For example, a simple bar graph can be used to show the number of students in a class who have different eye colors. The height of each bar represents the number of students with that particular eye color.Similarly, a number line can be used to show the relationship between numbers, such as greater than or less than. Students can also practice counting and identifying patterns on a co
Subjects:
Grades:
1st - 3rd
Types:
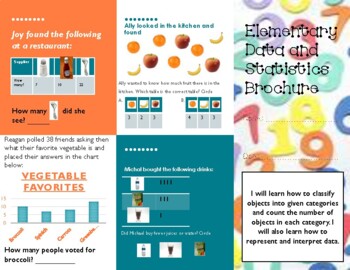
Lower Elementary Data and Statistics Brochure Activity (Data and Stat Standards)
This is a fun and interactive brochure activity RECOMMENDED For 1-3 grade. Use this activity in whole group, small group, independent math centers, homework, or as an assessment! This activity allows students to show their work in a unique and fun manner. This brochure follows data and statistic learning standards in grades 1-3. Students will learn how to classify objects into given categories and count the number of objects in each category. They will also learn how to represent and interpret d
Subjects:
Grades:
1st - 3rd
Types:
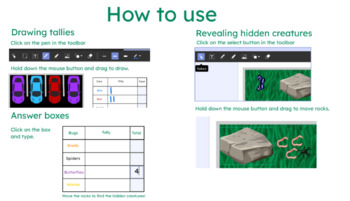
Tally Charts - DIGITAL ONLY - Easel Interactive
DIGITAL ONLY5 different tally chart activities to assign on Google Classroom using TPT's easel. Interactive, colourful and fun!
Subjects:
Grades:
K - 3rd
Types:
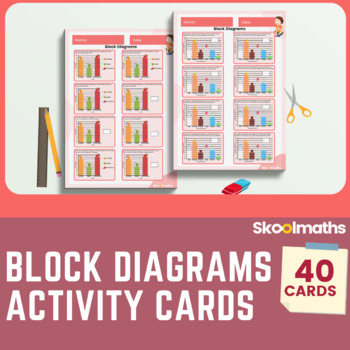
Bar Graph Activity Cards + Answer Key
Bar Graph Activity Cards + Answer Key #dollardealsAre you looking for a mix of no-prep bar graphs activities? This resource includes bar graph flashcards, worksheets, graphing questions, class graphs. Your students will be reading graphs and analyzing data in no time!This amazing collection of 40 colorful Bar Graph Activity Cards will provide extra engaging activities for your first-grade learners. Buy this great value bundle today to save you hours of planning and don't forget to leave an hones
Subjects:
Grades:
1st
CCSS:
Also included in: First Grade Math Bundle Interactive Lessons, Activities and Worksheets
Showing 1-8 of 8 results


