82 results
5th grade statistics resources for Easel
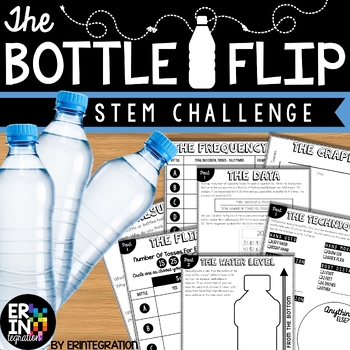
Water Bottle Flip STEM Challenge + STEM Activity
The ORIGINAL water bottle flip STEM activity and lab! Water bottle flip at school? Absolutely! Students will love this on-trend STEM challenge inspired by the popular YouTube water bottle flipping challenge where students toss a water bottle and attempt to land it straight up. Practice scientific method with some probability, fractions and data collection in the mix while having fun!This self-paced, low-prep, project based learning water bottle flip STEM challenge is print-and-go. Each activit
Subjects:
Grades:
3rd - 6th
Types:
CCSS:
NGSS:
K-2-ETS1-2
, K-2-ETS1-3
, MS-ETS1-2
, K-2-ETS1-1
, 3-5-ETS1-3
...
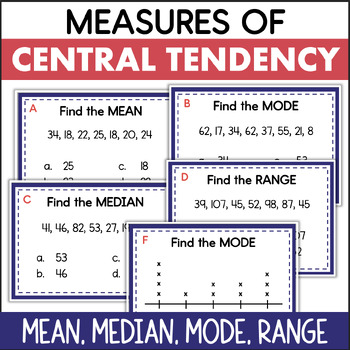
Mean Median Mode Range Measures of Central Tendency Data Task Cards
These data task cards are a great way for students to practice analyzing data to find the mean, median, mode, and range!There are several types of questions, all addressing measures of central tendency. Some require students to interpret a data set of whole numbers. Others involve data presented in a line plot. The last type of question requires the student to choose the correct method for finding the mean, median, mode, or range.This math resource includes:16 task cardsrecording sheetanswer key
Subjects:
Grades:
5th - 7th
Types:
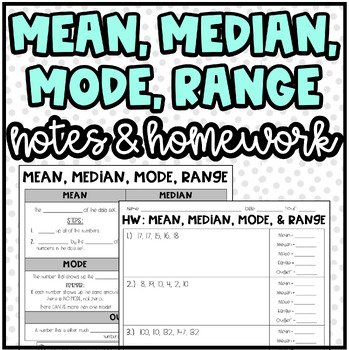
Mean, Median, Mode, Range, and Outlier | Notes and Homework or Practice
Notes & Homework: Mean, Median, Mode, Range, and Outlier:I used these notes, practice, and homework with my students. I used this lesson to serve as a "quick lesson" for the students. It covers how to find the mean, median, mode, range, and outlier.Product Includes:Notes Page with 2 examplesNotes Page Answer KeyHomework (10 organized problems with workspace provided)Homework Answer KeyThank You! ❤️I really appreciate your interest in my product! I love to create new things for my students! A
Subjects:
Grades:
5th - 8th
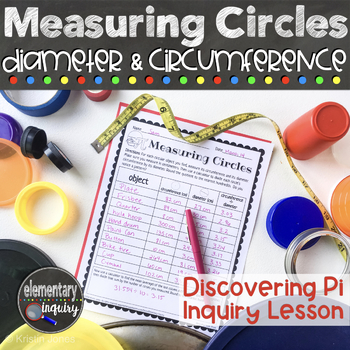
Measuring Circle Circumference & Diameter to Discover Pi - Pi Day Inquiry Lesson
Have fun finding Pi by measuring the circumference and diameter of circles of all sizes! Students will calculate the ratio of the length of a circle’s diameter to its circumference. They’ll discover that the circumference is always a little more than three times as long as the diameter. This full lesson plan and teacher script will help you lead an inquiry based investigation and class discussion. It’s perfect for an introduction to these geometry concepts, or for a fun Pi Day activity.A full, f
Subjects:
Grades:
5th - 7th
Types:
CCSS:
Also included in: Pi Day Activities - Measuring Circles Diameter, Circumference, and Area
Class Survey Activity - Common Core 6th Grade Statistics Project
This "Class Survey Activity" includes a two page activity aligned to common core standards for statistics and probability (6.SP).
Students will have to come up with a statistical question to survey their classmates. Then, the students will record their results, create a graph, and analyze their data. Lastly, the students will present their results with the class. With my class, I give the students at least a full class period to complete the activity, and then it takes another class perio
Subjects:
Grades:
5th - 7th
Types:
Also included in: Math Assessments and Review Activities BUNDLE for 6th Grade Common Core
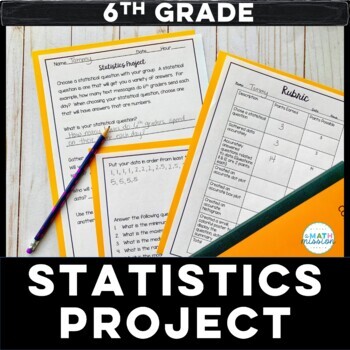
Math Statistics Project Based Learning Dot Plot Box Plot Histogram
Set your students loose to practice their statistics skills! This project is great for a culminating assessment. This project is centered around students coming up with a statistical question, and gathering data on that question. Students answer statistical questions, and create a dot plot, box and whisker plot and histogram based on the data collected. A summary of their findings is then created to display for others to see. A rubric is included for grading purposes. This project actively
Subjects:
Grades:
5th - 7th
Types:
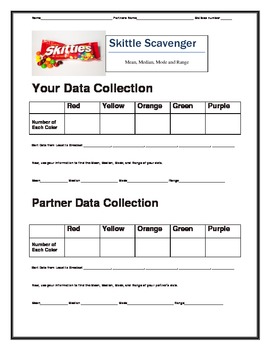
Skittles Candy with Mean, Median, Mode, Range, and Box and Whiskers Plot
This is a quick, fun activity to use with statistics. I have the kids bring in a pack of skittles and sort by color. Then all of the kids will find the Mean, Median, Mode, Range, and Box and Whiskers.
Subjects:
Grades:
4th - 8th
Types:
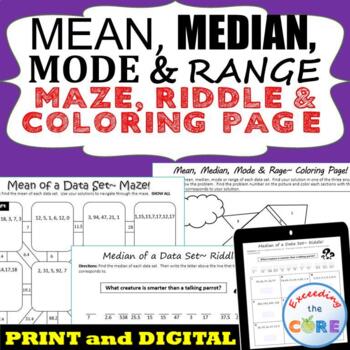
MEAN, MEDIAN, MODE, & RANGE Mazes, Riddles & Coloring Page | Print and Digital
Have your students apply their understanding of finding the MEAN, MEDIAN, MODE, & RANGE of data sets with these fun activities including a maze, riddle and coloring activity. What is Included:1. Finding the Mean MAZEThis is a self-checking worksheet that allows students to strengthen their understanding of finding the mean of positive whole numbers. Students use their answers to navigate through the puzzle.2. Finding the Median RIDDLEStudents find the median of positive whole numbers and use
Subjects:
Grades:
5th - 7th
Types:
Also included in: 6th Grade Math Assessments, Notes, Task Cards, Worksheets BUNDLE
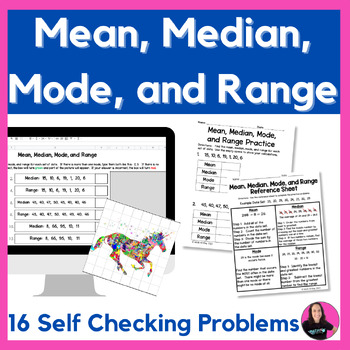
Measures of Central Tendency - Mean, Median, Mode, and Range Activity
In this 6th grade math resource, students will practice finding the mean, median, mode, and range. They will calculate the measures of central tendency with 16 problems, using four different sets of data. This activity is digital and printable. One of the printable pages is a reference sheet, which gives an example set of data and how to find the mean, median, mode, and range.For the digital activity, students will love watching the mystery picture reveal itself as more and more questions ar
Subjects:
Grades:
5th - 7th
Types:
CCSS:
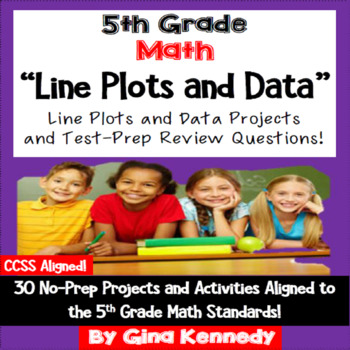
5th Grade Data and Line Plots, 30 Enrichment Projects and 30 Test-Prep Problems
No-prep, 5th grade line plots and data math practice with 30 enrichment projects and 30 review test-prep questions aligned to the 5th grade math standards. A great way to teach the data standards in a fun, engaging way. Perfect for early finishers, advanced math students or whole class practice. Print and go math enrichment! These work perfectly for distance learning as well.This resource is aligned to the 5th grade math CCSS standards: 5.MD.B.2. (However, this resource is perfectly suitable t
Subjects:
Grades:
5th
Types:
CCSS:
Also included in: 5th Grade Math Projects For Every Standard! Enrichment All-Year Bundle!
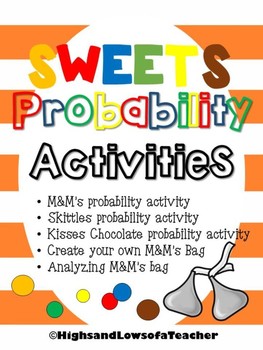
Sweets Probability Activities (chocolate, candy, M&Ms, Skittles, Kisses)
Uses chocolates or candy (M&Ms, Skittles, Kisses) to practice probability!
What's included-
*Colored candy probability activity: have students randomly pick colored candy and tally what's picked to experiment probability
*Colored candy probability activity reflection page- have students reflect on the experiment and explain their thinking
*M&M's probability activity: have students figure out how many M&M's are in a bag and what color of each by using probability
*M&M's probabil
Subjects:
Grades:
2nd - 8th
Types:
Also included in: Probability Activity BUNDLE
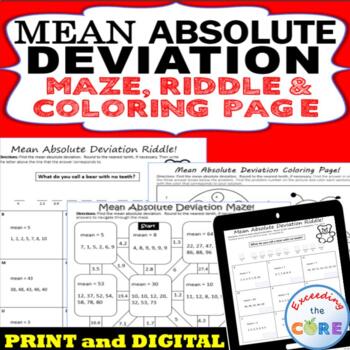
MEAN ABSOLUTE DEVIATION Mazes, Riddles & Coloring Page | Print and Digital
Have your students apply their understanding MEAN ABSOLUTE DEVIATION with these fun activities including a maze, riddle and coloring activity.What's Included:1. Mean Absolute Deviation MAZEThis is a self-checking worksheet that allows students to strengthen their understanding of finding the mean absolute deviation. Students use their answers to navigate through the puzzle.2. Mean Absolute Deviation RIDDLEStudents find the mean absolute deviation of various data sets. Students use their answer
Subjects:
Grades:
5th - 7th
Types:
Also included in: 6th Grade Math Assessments, Notes, Task Cards, Worksheets BUNDLE
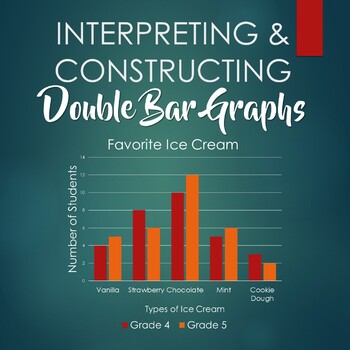
Interpreting and Constructing Double Bar Graphs - Booklet
This booklet includes six worksheets:- 3 double bar graphs for students to interpret- 3 sets of data for students to construct double bar graphs, with corresponding questions- answer key
Subjects:
Grades:
3rd - 6th
Types:
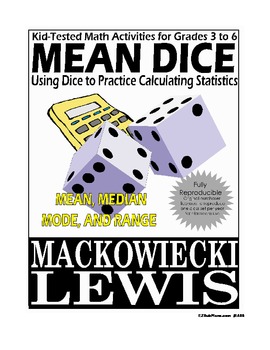
Mean Dice Math: mean, median, mode, and range
"Mean Dice" uses dice to practice calculating mean, median, mode, and range. Comes with two versions, each with a whole group introductory activity, an independent practice worksheet, and instructions for both levels of the "Mean Dice" game. Note: versions of this activity appear in EZSubPlans 4.1 and 6.1.
Subjects:
Grades:
4th - 7th
Types:
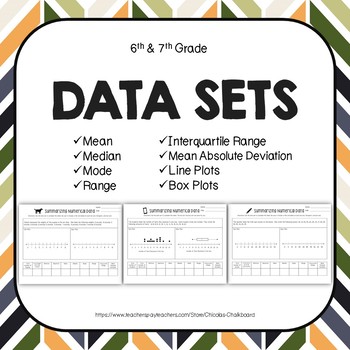
Data Sets: Mean, Median, Mode, Range, Interquartile Range, Box Plots, Dot Plots
Using this activity, students will be able to analyze data sets using box plots and dot plots. They will find the following: minimum, maximum, mean, median, mode, range, interquartile range, and mean absolute deviation. They will also create the box plots and dot plots using the data provided. This set includes: -Common Core State Standards-Two Reference Sheets (Key Data Set Terms and How to Create a Box Plot)-Four Different Data Worksheets 1. One data sheet that includes a completed dot p
Subjects:
Grades:
5th - 7th
Types:
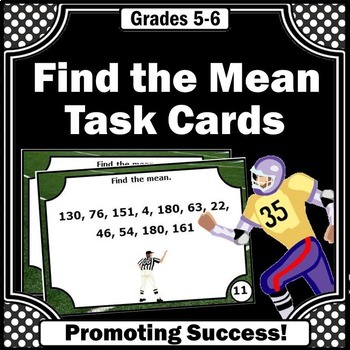
Probability and Statistics Activities Find the Mean Average of Data Task Cards
You will download 30 math task cards for your 5th and 6th grade students to practice and review finding the mean task. They work well with your measures of central tendency unit. A mean in math is the average of a data set, found by adding all numbers together and then dividing the sum of the numbers by the number of numbers.For your convenience, you will download both TPT digital EASEL and printable PDF resource formats. ☛ Please click on the PREVIEW above.You may use the printable task cards i
Subjects:
Grades:
5th - 6th
Types:
CCSS:
Data and Graphs Projects, 5th and 6th Grade Math Enrichment
Fun Data and Graph Enrichment Projects Students Love! Nine fun math projects that range from finding distances from cities to Olympic records and even charting calories on a super sized cheeseburger. The fun and creative projects utilize line plots, line graphs, bar graphs, double bar graphs, pie/circle graphs, mode, median, mean and range. I've also included a set of vocabulary terms, sample graphs and and a rubric! Print and go math enrichment! Perfect for distance learning as well.Please che
Subjects:
Grades:
4th - 6th
Types:
Data Analysis Task Cards Math Test Prep - Easel Activity Digital and Print
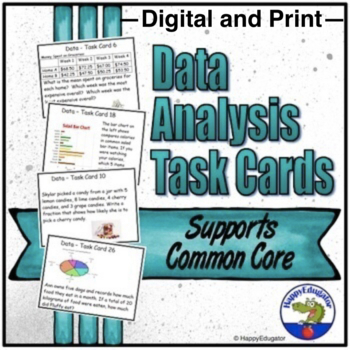
Data Analysis Task Cards. 30 task cards on data collection and data analysis, answer recording sheet, and answer key. Great for math test prep. Print or digital. Tasks includes finding range, median, mode and mean of a set of data, creating pictographs, interpreting line plots, stem and leaf plots, bar graphs, circle graphs, box and whisker plots, probability, random and biased samples.Digital and Print: Includes an Easel Activity ready for learning with digital tools. Assign it online in Googl
Subjects:
Grades:
5th - 8th
Types:
FREE Statistics and Probability Mean Median Mode Range Task Cards 5th 6th Grade
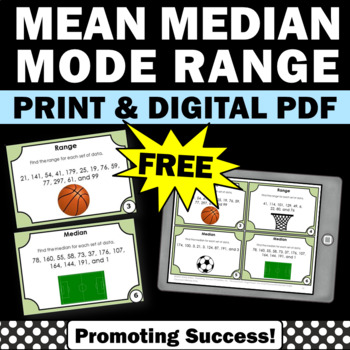
DIGITAL PDF AND PRINTABLES: You will download six free mean, median, mode and range task cards for your 5th or 6th grade students to practice finding the mean, median, mode and range. You may use the printable task cards in math centers or stations for fun review games and activities, such as a scavenger hunt or SCOOT. They also work well for transition activities, as exit tickets and for morning work, quick formative assessments. Game ideas, a student response form and answer key are included.✔
Subjects:
Grades:
5th - 6th
Types:
CCSS:
Mean, Median, Mode & Range Guided Notes
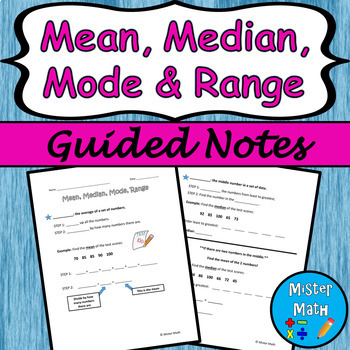
This is a guided notes resource to assist students in learning about finding the mean, median, mode, and range of data sets. The guided notes include definitions, as well as a guided example for each skill. An independent practice worksheet is included that asks students to find the mean, median, mode and range for four data sets (for a total of 16 extra practice problems!) An answer key is also provided.This Guided Notes packet is also part of a BUNDLE that includes a PowerPoint presentation to
Subjects:
Grades:
3rd - 6th
Also included in: Mean, Median, Mode & Range PPT and Guided Notes BUNDLE
Finding Mean, Median, Mode, and Range
Simple worksheets (5 problems each) to introduce and practice finding the mean, median, mode, and range of a data set. Have students complete with or without calculator, depending on their instructional level. Product includes:-Reference posters for mean, median, mode, and range. Each poster includes the measures' definitions and directions for how to find them with an example.-5 worksheets about finding the mean.-5 worksheets about finding the median.-5 worksheets about finding the mode.-5 work
Subjects:
Grades:
1st - 12th
Types:
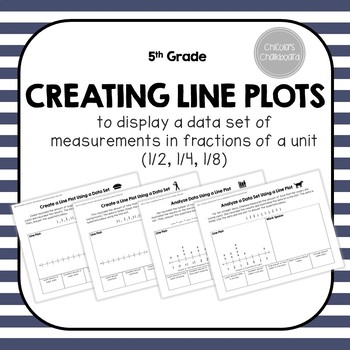
Line Plots with Fractions - Data Sets with Student Reference Sheet
Using this activity, students will be able to analyze data sets by using line plots. They will find the following: minimum, maximum, total amount, range, average, and most common. They will also create the line plots using the data provided.
This set includes:
-Table of Contents and Common Core State Standards
-Two Reference Sheets (Key Terms and How to Create Line Plot)
-Four Different Data Worksheets
1. One data sheet that includes a completed line plot
2. One data sheet that
Subjects:
Grades:
5th
Types:
CCSS:
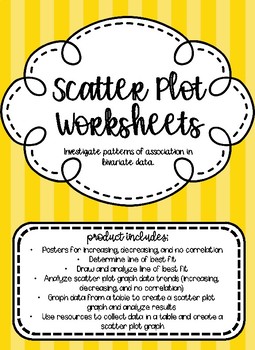
Scatter Plot Graph Worksheets
A collection of worksheets to use when teaching how to investigate patterns of association in bivariate data. Product includes 3 posters for students to reference how to determine if data is increasing, decreasing, or has no correlation. Types of worksheets include:
-Determine line of best fit
-Draw and analyze line of best fit
-Analyze scatter plot graph data trends (increasing, decreasing, and no correlation)
-Graph data from a table to create a scatter plot graph and analyze results
-Use reso
Subjects:
Grades:
1st - 12th
Types:
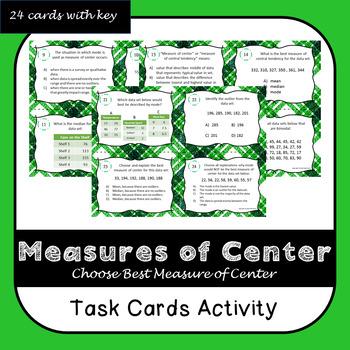
Measure of Center Task Cards
Great review! These 24 task cards provide more emphasis on choosing the best measure of center rather than just finding mean, median, and mode. Data sets are in tables or in lines. Vocabulary like bimodal (2questions), outlier (2questions), and definitions for mean, median, mode are used.16 multiple choice questions4 choose all answers (technology enhanced type) questions4 fill in blank questionsMeasure of Central Tendency; Mean, Median, Mode; Best Measure of CenterLike this product? Check o
Subjects:
Grades:
5th - 7th
Types:
CCSS:
Showing 1-24 of 82 results


