43 results
1st grade statistics resources for Microsoft PowerPoint
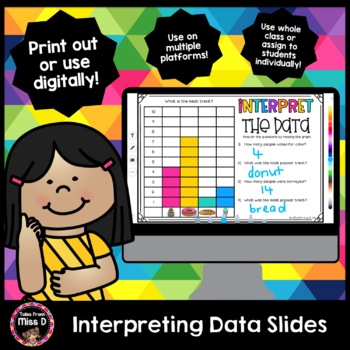
Interpreting Data Slides
Help develop students' ability to collate data and interpret graphs with these slides.There are two styles of questions;Tally - students count the data and use tally marksInterpret a Graph - students read the graph and answer questionsThese slides can be printed out, used in the classroom with your students or uploaded into your digital classroom for distance learning.Have a question? Use the Product Q & A or email me at talesfrommissd@gmail.comRelated ProductsSpin and GraphSight Word Spin a
Subjects:
Grades:
K - 2nd
Types:
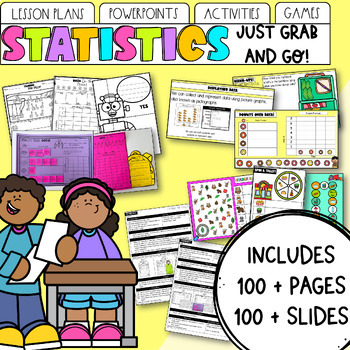
Statistics & Data | Maths Unit: Lessons, PowerPoint, Activities & Games
Looking for statistics and graphing planning that ticks all your boxes? Look no further! Teaching is hard enough, without spending hours creating differentiated lesson plans and activities. Not to mention the time spent planning what your early finishers can do, what assessment points to consider, or sourcing games that consolidate previous skills! With this Statistics and Data Unit, everything is done for you. Want to buy in early to the discounted bundle and get all updates for free? Find my G
Subjects:
Grades:
K - 2nd
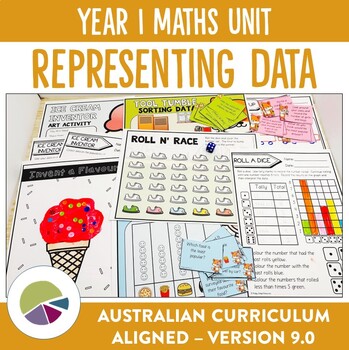
Australian Curriculum 9.0 Year 1 Maths Unit Data
Help your students learn how to apply data skills with this unit plan and activity bundle. Bring your maths lessons to life as the unit plan walks you through everything you need to thoroughly cover the AC9M1ST01 and AC9M1ST02 elements of the Australian Year 1 Maths curriculum (version 9.0). Fun for students, easy for you to implement and an irresistible way to help budding mathematicians learn how to use data in a variety of ways!Bring the fun back into learning about data as you guide your stu
Subjects:
Grades:
K - 2nd
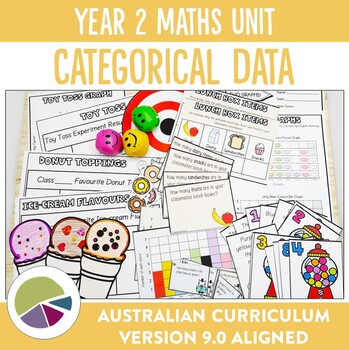
Australian Curriculum 9.0 Year 2 Maths Unit Data
Help your students collect data and interpret graphs with this unit plan and activity bundle. Bring your maths lessons to life as the unit plan walks you through everything you need to thoroughly cover the AC9M2ST01 and AC9M2ST02 elements of the Australian Year 2 Maths curriculum (version 9.0). Fun for students, easy for you to implement and an irresistible way to help budding mathematicians explore data.Bring the fun back into learning about data as you guide your students through the followin
Subjects:
Grades:
1st - 3rd
Also included in: Ultimate Australian Curriculum 9.0 Year 2 Units Bundle
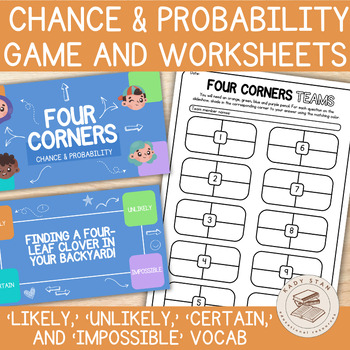
Chance and Probability Game | Slideshow Activity & Worksheets | 2nd Grade Maths
*Topic: Chance and Probability exploring the vocabulary of likely, unlikely, certain, and impossible* Our reimagined Four Corners is a dynamic classroom game where students respond to questions posed by the teacher by physically moving to one of four corners in the room, each representing a different answer option. It's a fun and interactive way to engage students whilst they learn, and you assess their understanding of the topic. THREE WAYS TO PLAY: Traditional Four CornersUtilise a digital de
Subjects:
Grades:
1st - 3rd
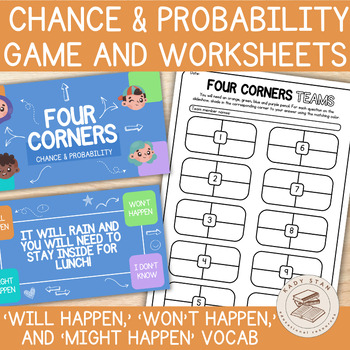
Chance and Probability Game | Slideshow Activity & Worksheets | 1st Grade Maths
*Topic: Chance and Probability exploring the vocabulary of will happen, won’t happen, and might happen* Our reimagined Four Corners is a dynamic classroom game where students respond to questions posed by the teacher by physically moving to one of four corners in the room, each representing a different answer option. It's a fun and interactive way to engage students whilst they learn, and you assess their understanding of the topic. THREE WAYS TO PLAY: Traditional Four CornersUtilise a digital
Subjects:
Grades:
1st - 3rd
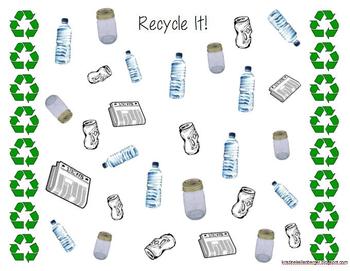
Recycle It! Tally Activity
This is my first worksheet to upload to TPT and I hope you can find it useful!This activity was created to incorporate Earth Day, recycling, and math concepts of tallying and graphing. Use the first page of the various items that we recycle (paper, glass, aluminum, and plastic) as a map to be left at a Math Center. The second page is the students' recording sheet. Students should mark a tally for each item, count the tallies, and then create a graph. There are two versions included, one full col
Subjects:
Grades:
K - 2nd
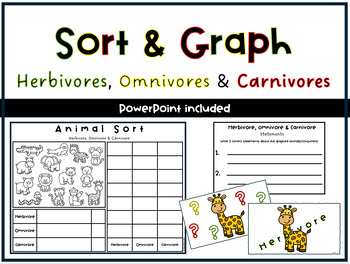
Sorting and Graphing- Herbivores, Omnivores & Carnivores
Combine Science and Maths with this graphing activity!Learn which category each animal falls unders (herbivore, omnivore or carnivore) and display your findings using tally marks and a bar graph. Then make 2 correct statements about what you graph is showing. A PowerPoint is included for the teacher to use and create more class discussion.
Subjects:
Grades:
K - 3rd
Data Representation Powerpoint
The presentation contains: 1) TALLY MARKS Learning Objectives. Definition of a tally mark. Uses of tally mark. How to count a tally mark. Tally Mark Chart. Construction of a tally mark table with an example. Application on real life problems on tally mark. Read and Interpret a tally mark table.The presentation contains: 2) FREQUENCY DISTRIBUTION TABLEDefinition of a Frequency Distribution Table. Types of Frequency Distribution Table: a) Discrete Frequency Distribution Table (Ungrouped).b) C
Subjects:
Grades:
1st - 10th, Higher Education, Staff
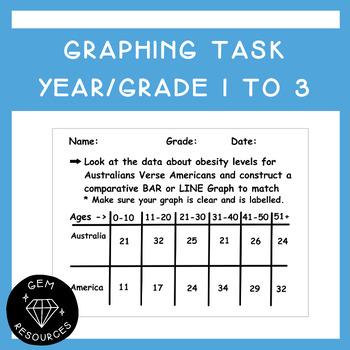
Graphing Assessment/Activity - Year/Grade 1 to 3 Data Statistics Maths
Students are required to:- create a comparative line or bar graph- show appropriate labelling to their graph- make statements about the data- make predictions based off the data- pose further questions in relation to the data for real world scenariosThis document is a PowerPoint.
Subjects:
Grades:
1st - 3rd
Método Científico Kindergarten
Este paquete incluye carteles tamaño 8 1/2 x 11. Los mismos son coloridos y con imágenes atractivas y vocabulario para los estudiantes. Los carteles están listos para imprimir y laminar. Son perfectos para decorar el área de Ciencia. Las hojas de trabajo para los estudiantes incluye destrezas como: contar, identificar, recortar, colorear y más.El paquete incluye:1.Siete carteles con los Pasos del Método Científico2.Seis hojas para trabajar cada paso3.Un librito con los pasos del Método Científic
Subjects:
Grades:
K - 1st
Types:
All About Data PowerPoint Presentation
Data power point is a 40 page slide show about data or collecting information. The power point explains ways people can collect data. It explains what a survey is and ways to gather information. After conducting the survey, sorting the information into categories can help you learn something about the group. The power point explains ways to show information through a bar graph, line plot or pictograph. It also explains the history of data and how it is the basis for mathematics. Questions
Subjects:
Grades:
1st - 6th

Probability: PowerPoint Lesson, Leveled Practice, Assessment
Teach, practice, and assess probability with this bundle!
The .zip file includes:
1- Probability Powerpoint Lesson
2- Below-Level Practice Sheet
3- On-Level/Advanced Practice Sheet
4- Assessment
Subjects:
Grades:
1st - 5th
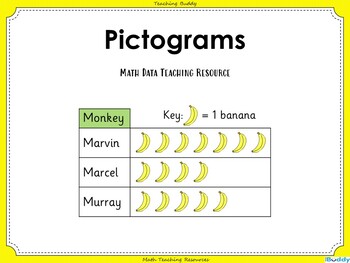
Pictograms
PictogramsIn this math teaching resource, students practice drawing and interpreting pictograms where the picture represents 1, 2, 5 or 10. Content includes:PowerPoint presentationActivities to support the teaching of this objective with six accompanying worksheetsThree further differentiated worksheets with answers'Pictograms' can be edited so you are able to adapt the resource for each class you teach.Click on the preview to see some example slides from 'Pictograms'.
Subjects:
Grades:
K - 2nd
CCSS:
Also included in: Introduction to Statistics Bundle
Put on Your Math Goggles - Paul Klee's Castles and Bar Graphs
Transform your mathematics classroom into an art gallery by using a work of art as the focal point to a mathematics lesson!
Open your mathematics lesson by students viewing a PowerPoint (with informational footnotes; 9 slides) featuring the life and works of the artist, Paul Klee. With their math goggles™ on, students count the number of shapes used in their own Paul Klee-inspired art, generate a bar graph of this data, and then discuss/compare/contrast their bar graphs. Excite students about
Subjects:
Grades:
K - 2nd
Tally charts lesson plans, worksheets and more
This is a zipped folder containing a PDF version and an editable version of the following items:
- blank tally charts
- a more detailed 2-page lesson plan (suitable for trainees)
- a less detailed one page lesson plan
Subjects:
Grades:
K - 2nd
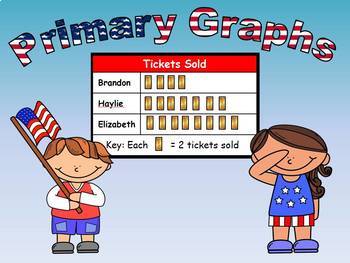
Primary Graphs Unit (Line Plot, Bar, Pictograph, Pie, and Line)
This compressed files contains all the materials you need to teach your primary students about graphing 7 different data surveys as line plots, bar graphs, or pictographs. Inside the folder is a PowerPoint presentation to teach the concepts as your students complete each of the 7 graphs. (There is also an equivalent SmartBoard Notebook presentation of the same lesson)• CCSS.Math.Content.1.MD.C.4• CCSS.Math.Content.2.MD.D.10Also included is an Excel spreadsheet that will show your primary student
Subjects:
Grades:
K - 2nd
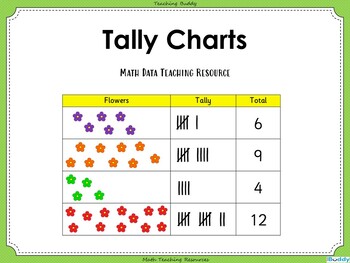
Tally Charts
Tally ChartsIn this math teaching resource, students will learn how to interpret and construct simple tally charts. Content includes:PowerPoint presentationActivities to support the teaching of this objective with two accompanying worksheetsThree further differentiated worksheets with answers'Tally Charts' can be edited so you are able to adapt the resource for each class you teach.Click on the preview to see some example slides from 'Tally Charts'.
Subjects:
Grades:
K - 2nd
CCSS:
Also included in: Introduction to Statistics Bundle
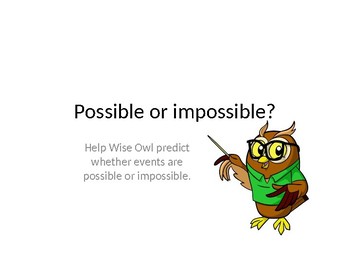
Impossible or Possible?
Students will have fun learning about the terms "possible" and "impossible" with this slide show.
Each slide shows a picture and asks "is this possible or impossible?" have the students state what they think, and then click on the slide to reveal the answer.
Young students will love the idea of helping "wise owl" and have a laugh at some of the absurd pictures.
Subjects:
Grades:
1st
Types:
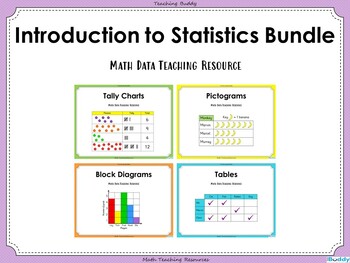
Introduction to Statistics Bundle
Introduction to Statistics BundleThis math teaching resource bundle contains 4 of our individual teaching resources:Tally ChartsPictogramsBlock DiagramsTables For a full description and preview of each resource please click on the images above.This bundle gives you a saving of 33% when compared to buying each resource individually.
Subjects:
Grades:
K - 2nd
The Great Graph Challenge - Digital Graphing Lesson
The Great Graph Challenge is a lesson that was created around Loreen Leedy's book, The Great Graph Contest. In this digital math lesson students will will listen to a read aloud of Leedy's book and then complete a graphing challenge of their own. This lesson works on the methods of data collection and how to organize data in a way that makes analyzing the information a breeze! This lesson was designed for students of varying abilities. **This lesson can be used in group or 1:1 sessions. It is re
Subjects:
Grades:
1st - 2nd, Adult Education
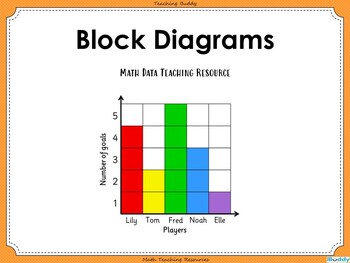
Block Diagrams
Block DiagramsIn this math teaching resource, students practice drawing, reading and using block diagrams to record information. Content includes:PowerPoint presentationActivities to support the teaching of this objective with two accompanying worksheetsThree differentiated worksheets with answers'Block Diagrams' can be edited so you are able to adapt the resource for each class you teach.Click on the preview to see some example slides from 'Block Diagrams'.
Subjects:
Grades:
K - 2nd
Also included in: Introduction to Statistics Bundle
Drawing bar graphs lesson plans, worksheets and more
This is a zipped folder containing a PDF version and an editable version of the following items:
- blank bar graphs
- a more detailed 2-page lesson plan (suitable for trainees)
- a less detailed one page lesson plan
- a bar graph plenary
- drawing bar graphs success criteria
Subjects:
Grades:
K - 2nd
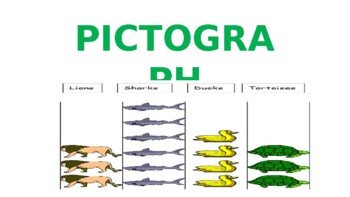
Pictograph Powerpoint
The presentation contains:Learning Objectives.Definition of a Pictograph.Parts of a pictograph.Tips for construction of pictograph.Steps to construct pictograph with an example.Scaling and drawing a pictograph.Read and Interpret a pictograph.
Subjects:
Grades:
1st - 7th, Staff
Also included in: Data Representation Powerpoint
Showing 1-24 of 43 results


