1,525 results
4th grade statistics resources under $5
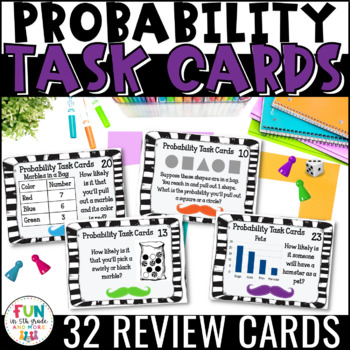
Probability Task Cards Math Review
Probability Task Cards help students practice probability in a fun way. Use these task cards for various activities or math centers to teach/review probability skills such as compound events, likelihood of an event, combinations., and MORE! Use for Scoot, small groups, centers, or whatever else you can think of!This set of 32 cards covers skills such as:**determining the probability of an event**stating whether an event is certain, impossible, least likely, most likely, or equally likely**comp
Subjects:
Grades:
3rd - 6th
Types:
Also included in: Math Task Card Bundle
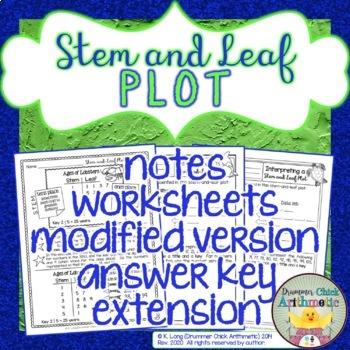
Stem and Leaf Plot Notes and Worksheets
Show your students that a stem-and-leaf plot is actually a pretty easy and fun (yes, fun!) way to organize data with these worksheets and notes based on animals' life spans. On these two worksheets, students write the data from a graph and then create a graph based on a set of data. Notes about interpreting a stem and leaf plot are included!Can I modify this for my learners?Yes! Modified versions of the worksheets are included. An extension is also included for your early finishers (students
Subjects:
Grades:
4th - 7th
Types:
Also included in: Stem and Leaf Plot Bundle
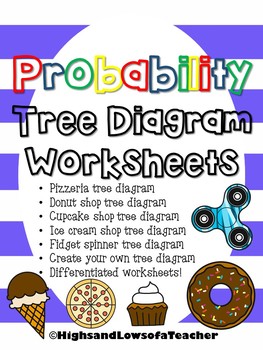
Probability Tree Diagram Worksheets
Use these tree diagram worksheets to help students learn all the outcomes (combinations) for probability unit.What's included-*Pizza toppings probability tree diagram*Donut probability tree diagram*Cupcake probability tree diagram*Ice cream probability tree diagram*Fidget spinner probability tree diagram*Create your own tree diagramAll worksheets come differentiated---one page that has tree diagram drawn in with some combinations already filled-one with tree diagrams drawn in-one blank page only
Subjects:
Grades:
3rd - 8th
Types:
Also included in: Probability Activity BUNDLE
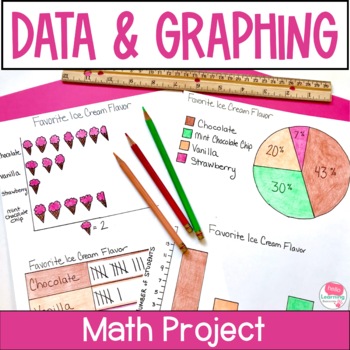
Data and Graphing Project - Real World Math Project Based Learning Activities
This data and graphing project gives your students a meaningful way to apply their data and graphing skills. Use this real world math project as an end of unit activity, enrichment activity or assessment. Easy to use and fun for students!Click the PREVIEW button above to see everything that is included in this fun math project!⭐ This resource includes:teacher information, directions and sample schedulesupply listgrading rubricstudent direction sheettwo data collection sheets (one for open ended
Subjects:
Grades:
4th - 6th
Types:
CCSS:
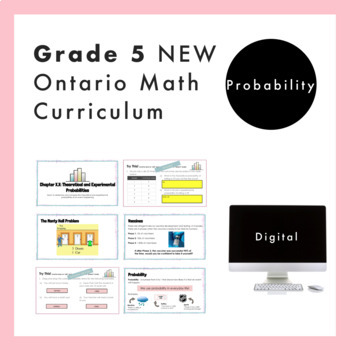
Grade 5 Ontario Math - Probability Curriculum - Digital Google Slides+Form
Are you planning for the NEW Grade 5 Ontario Math Curriculum? This fully editable, NO PREP Google Slide resource is what you need! This resource is for the DATA strand and covers all specific expectations for “D2. Probability”. In this resource, students will experience math through engaging real-life questions, storytelling through math, and interactive slides. For teachers who are given Nelson© Math by your board, this resource loosely follows the order of the Probability chapter (Chapter 13)
Subjects:
Grades:
4th - 6th
Also included in: Grade 5 NEW Ontario Math Curriculum Full Year Digital Slides Bundle
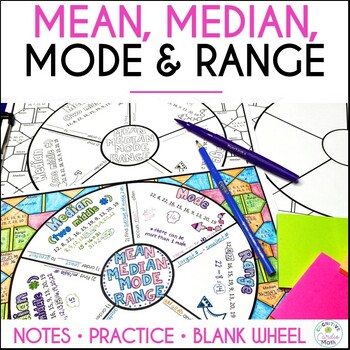
Mean, Median, Mode, Range Math Doodle Wheel | Notes and Practice Activity
Use this mean, median, mode, range doodle math wheel for notes and practice. Introduce each data measurement type as you teach it, or, you can use the math wheel to review all of them at once.What is a math wheel? A math wheel is a type of graphic organizer where students can:Take notes/guided notes inside the math wheelUse color, drawing, and doodling to help create memory triggersComplete practice problems in the pattern around the wheel, andColor the background patternStudents can keep these
Subjects:
Grades:
4th - 6th
Also included in: Mean, Median, Mode, Range Activity Bundle Math Centers
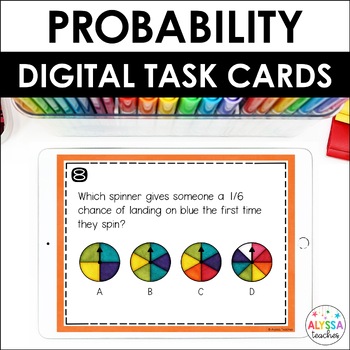
Probability Task Cards (Digital)
Probability is one of my favorite math topics to teach! These digital probability task cards make a great review activity for math centers, warmups, early finishers, and more. You can use this set during your probability unit or save it for an end-of-year test review.To complete the task cards, students move objects on the screen and type answers to questions. They'll complete everything directly in Google Slides. No prep for you; no lost papers for them!Students will:use probability vocabulary
Subjects:
Grades:
4th - 5th
Types:
CCSS:
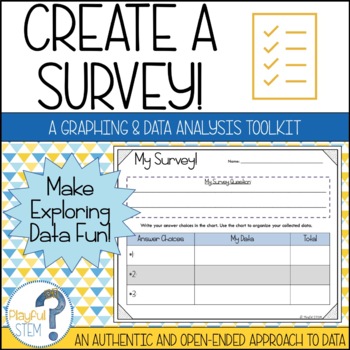
Create Your Own Survey: Collect, Organize, Graph, and Analyze Data
One of my best-selling TPT products -- now updated with a fresh look and new content!Teach Data Analysis the open-ended and engaging way -- through student-directed surveys!This resource pack is designed to help students follow the process of creating a survey: they will brainstorm questions, collect data, organize their obtained data, create multiple graphs to show their data, and then reflect on and analyze what their data tells them.The survey pack includes the following:Brainstorming Survey
Subjects:
Grades:
2nd - 5th
Types:
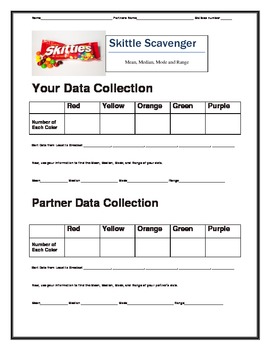
Skittles Candy with Mean, Median, Mode, Range, and Box and Whiskers Plot
This is a quick, fun activity to use with statistics. I have the kids bring in a pack of skittles and sort by color. Then all of the kids will find the Mean, Median, Mode, Range, and Box and Whiskers.
Subjects:
Grades:
4th - 8th
Types:
Also included in: Statistics Unit
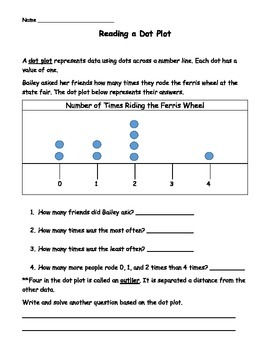
Dot Plot Worksheets
Students will read and create dot plots with these four worksheets. Students get experience interpreting data from dot plots as well as using vocabulary such as an outlier.
Two worksheets are reading a dot plot.
Two worksheets are creating dot plots from frequency tables including using a class survey of hours of sleep for data.
Answer key included for pages.
If you like this product, please rate me! I appreciate your feedback.
More math items can be found at my store, Always Love Learning.
Subjects:
Grades:
3rd - 6th
Types:
Statistics Mean, Median, Mode & Range Interactive PowerPoint by Erica
Introduce statistics including mean, median, mode and range with this colorful, interactive 22 slide PowerPoint. This interactive PowerPoint introduces each term and teaches a strategy for finding the value. There is also a trick or visual to help students remember the steps to find each one (mean, median, mode and range). Students are able to practice finding the mean, median, mode and range and then check within the PowerPoint. This is excellent for a statistics lesson or for students to e
Subjects:
Grades:
3rd - 6th
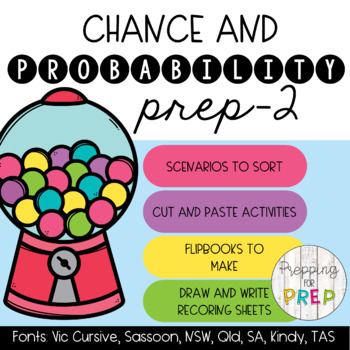
CHANCE AND PROBABILITY (FOUNDATION TO YEAR 2 ACTIVITY PACK)
This activity pack includes a variety of activities for you to use when teaching chance and probability using the language of will happen, might happen, will not happen and likely, unlikely and impossible. The resources include:Chance booklet where students cut along the dotted lines and draw and write about an event that will happen, might happen, will not happen (Or likely, unlikely, impossible). There are 7 font options and 1 with dotted thirds and one plain without lines to select from. What
Subjects:
Grades:
PreK - 4th
Types:
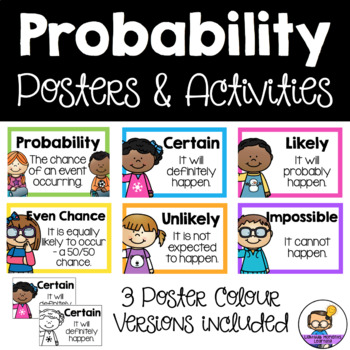
Probability Activities & Posters
It would be IMPOSSIBLE for you not to love these probability posters and activities! I am CERTAIN that these activities will be a fun addition to your classroom and provide a fun way to teach your students about probability.
This resource covers the terms Certain, Likely, Even Chance/Equally Likely, Unlikely and Impossible.
Posters included:
• Probability
• Certain
• Likely
• Even Chance (Equally Likely option included)
• Unlikely
• Impossible
Note: 3 colour versions included
Activities:
Subjects:
Grades:
1st - 4th
Types:
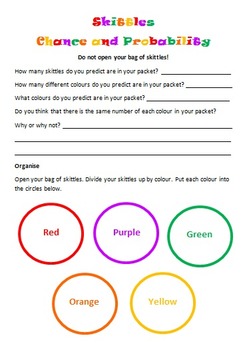
Skittles Chance and Probability (Editable)
Chance and Probability activity using yummy Skittles!!!
Students are to predict the colours and quantities before they open the skittles bag. Students are to complete a chance experiment where they use a tally to collect their data. Students then transfer their data in fractions, decimals and percentages. Students are to create a bar graph using their data as well as answer chance and probability questions about the data. I used this with my grade 5/6 students and they loved it!
Subjects:
Grades:
3rd - 10th
Types:
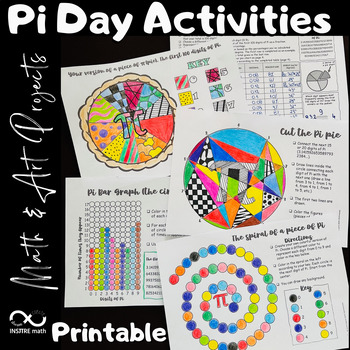
4 Pi Day Math Activities | Math & Art Projects | Coloring Circles | Pie Chart
4 Math & Art Projects to celebrate Pi Day that include circles and Pi exploration! Your students will love these Pi Day activities! Let your students express themselves using these hands-on Math & Art resources during the exploration of Pi.Content:- Your version of a piece of π (pie). The first 100 digits of Pi. Frequency Pie Chart.- Pi Bar Graph - the circular version.- The spiral of a piece of Pi.- Cut the Pi pie.This resource includes:- The editable PowerPoint™ version.- The printable
Subjects:
Grades:
4th - 8th
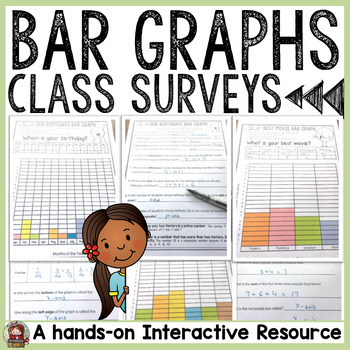
BAR GRAPHS: CLASS SURVEYS ACTIVITIES
BAR GRAPHS: SURVEYSThis Bar Graphs Class Surveys collection features collecting, graphing and interpreting data on topics your students will relate to. This is perfect for a getting-to-know-you back to school activity, or alternatively for applying graphing skills in real life situations.⭐ Separate folders featuring both British English and American spellings and terminology included.►What’s Included✅ 12 Class Surveys on topics of interest.✅ Choice of three Cover Sheets if compiling student su
Subjects:
Grades:
3rd - 6th
Types:
CCSS:
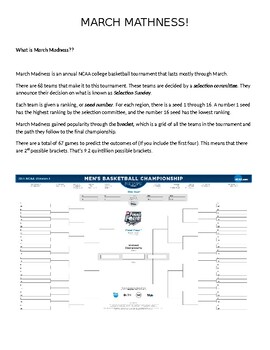
2024 March Mathness Madness NCAA Basketball Probability and Statistics Lesson
Every year I get my students excited about the NCAA Men's Basketball March Madness Tournament. I see articles written year after year from statisticians, sports journalist, celebrities, etc. about predicting the perfect bracket. Regardless that most have accepted it is nearly impossible, it has not deterred these enthusiast from finding an algorithm or a machine that can predict the outcomes.This packet guides students through 1) An explanation of what March Madness is all about2) A reading abou
Subjects:
Grades:
4th - 12th
Types:
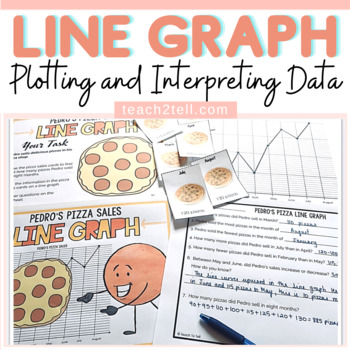
Line Graph Activity | Plotting and Interpreting Data on a Line Graph
Looking for a line graph activity that involves plotting and interpreting data on a line graph? Your students will enjoy this hands-on center activity that involves recording pizza sales over a given period using card visuals. They will get to plot and interpret data on a line graph.Items IncludedFile folder cover (2 options): if placing all items in a file at a centerSingle large task card (color and blackline) on a sheet outlining the taskTwo small task cards (color and blackline) on a sheet o
Subjects:
Grades:
2nd - 5th
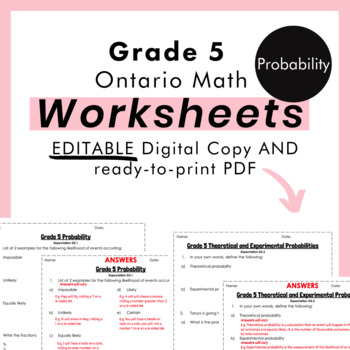
Grade 5 Ontario Math - Probability Worksheets - PDF+FULLY Editable Google Slides
Are you looking for practical and easy to use supplement practice for the NEW Grade 5 Ontario Math Curriculum? These ready-to-print PDF and EDITABLE worksheets is exactly what you need! Note this resource compliments my digital Probability unit, but can also be used separately! This resource contains 2 worksheets for your students to apply what they have learned in the Data strand for Probability. Each worksheet specifies which Ontario Curriculum Expectation is being covered. *These worksheets d
Subjects:
Grades:
4th - 6th
Types:
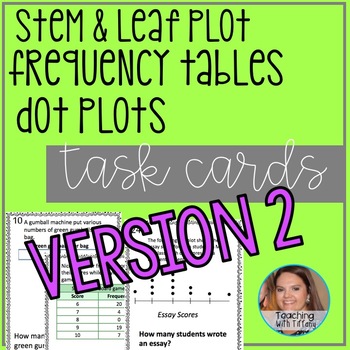
Stem and Leaf Plots, Frequency Tables, Dot Plot, Task Cards 2
This product contains 24 task cards dealing with stem and leaf plots, frequency tables, and dot plots. This is part 2 of my Stem and Leaf Plot, Frequency Table, and Dot Plot set. Part 2 was created to be slightly more difficult than Part 1. Part 1 was created for introduction, Part 2 is created for practice and requires different skills.
The students will need to have an understanding of:
Fractions (simplification)
Decimals (adding, subtracting, ordering)
Fractions (comparing)
Adding, Subtra
Subjects:
Grades:
4th - 6th
Types:
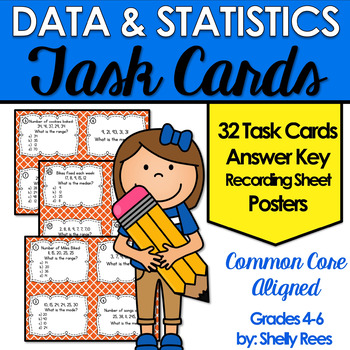
Mean, Median, Mode, Range Task Card and Poster Set - Data and Statistics
Mean, Median, Mode, Range, Data and Statistics is easier for students to master with this easy-to-use set of task cards and posters! Students will love the variety of practice with this task card set, and teachers will enjoy the little prep with big results!
Click here and SAVE by buying the Complete Bundle of Math Task Cards for Grades 4-6.
This helpful Data and Statistics Task Card Set includes:
• 32 Task Cards (28 on-level and 4 challenge)
• 5 Example and Teaching Posters
• 2 Standard Pos
Subjects:
Grades:
4th - 7th
Types:
CCSS:
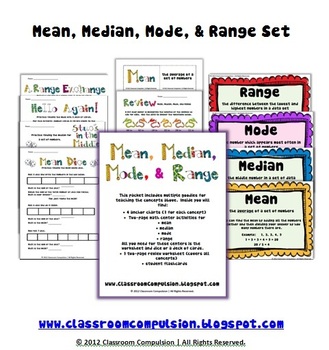
Mean Median Mode Range Pack (Math Centers, Flashcards, Anchor Charts)
This pack has everything you need to supplement your Mean, Median, Mode, and Range instruction! It includes 4 colorful anchor charts (1 for each concept)for you to display around the room, 4 two-page math centers that only require dice or a deck of cards (1 for each concept), a fun set of flashcards for your students, and a two-page review worksheet that covers all the concepts. The preview photos do not show all the pages.
Subjects:
Grades:
3rd - 6th
CCSS:
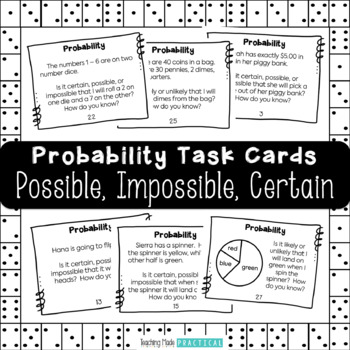
32 Probability Task Cards - Certain, Possible, Impossible, Likely, Unlikely
These 32 probability task cards are for helping students practice considering what probability events are certain, possible, impossible, unlikely, and likely. Students will read a short scenario, usually involving rolling a number die, spinning spinner, flipping a coin, or drawing marbles or counters out of a bag. Then, students are asked whether a certain event is certain / possible / impossible, or likely / unlikely. The majority of the task cards (24) focus on certain, possible, and imposs
Subjects:
Grades:
2nd - 4th
Types:
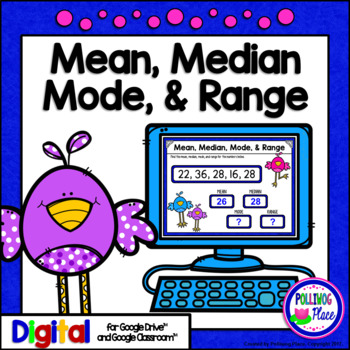
Mean Median Mode and Range - Statistics for Google Drive and Google Classroom
This Mean, Median, Mode, and Range data and statistics activity is designed for the interactive digital classroom using Google Drive (TM). Your students will practice finding the mean, median, mode, and range for sets of numbers.This activity set includes: * 20 slides for finding the mean, median, mode, and range * Student instruction slide * Getting started guide for teachers * Answer KeyThis is a low-prep activity that works with Google Drive (TM) and Google Classroom (TM). You wi
Subjects:
Grades:
4th - 6th
Types:
Showing 1-24 of 1,525 results


