637 results
Statistics Common Core 6.SP.A.1 resources
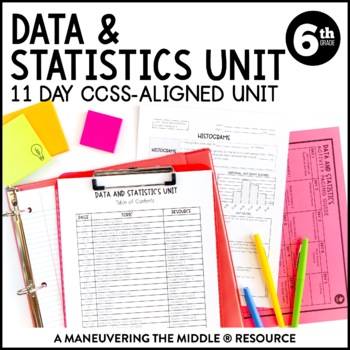
Data & Statistics Unit | Measures of Center, Dot and Box Plots, & Histograms
An 11 day CCSS-Aligned Statistics Unit - including statistical questions, describing data, and analyzing data with dot plots, box plots, and histograms. Students will understand measures of center and variability and how they relate to displays of data. Students will practice with both skill-based problems, real-world application questions, and error analysis to support higher level thinking skills. You can reach your students and teach the standards without all of the prep and stress of creatin
Subjects:
Grades:
6th
Types:
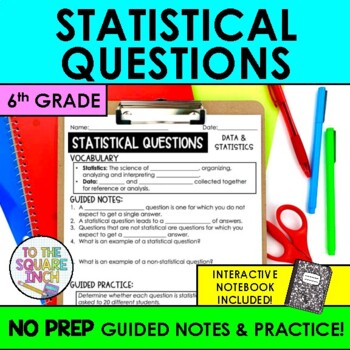
Statistical Questions Notes & Practice | Guided Notes + Interactive Notebook
Searching for an effective way to teach your students statistical questions? These NO PREP guided notes are a classroom proven resource that will save you time and have your students proficient in statistical questions in no time! With a comprehensive design, these notes offer a structured approach that can be differentiated for every level of learner. Guided notes are an effective teaching model that maximize your students ability to use working memory to focus on content, rather than copying d
Subjects:
Grades:
5th - 7th
CCSS:
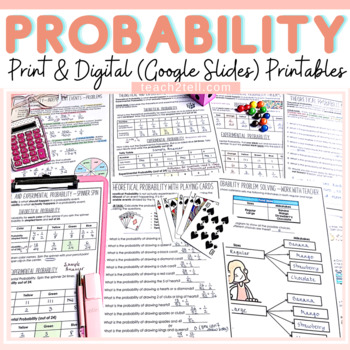
Chance and Probability Activities Print and Digital Worksheets |Google Classroom
Are you teaching your students all about chance and probability and looking for fun hands-on probability activities? This print and digital (google slides) bundle of probability worksheets will reinforce the understanding of theoretical probability, experimental probability, language of chance, sample space, predictions, lists, tree diagrams, dependent probability events and independent probability events.Both US and British English spelling and terminology included.Overview of Activities1. The
Subjects:
Grades:
4th - 8th
Types:
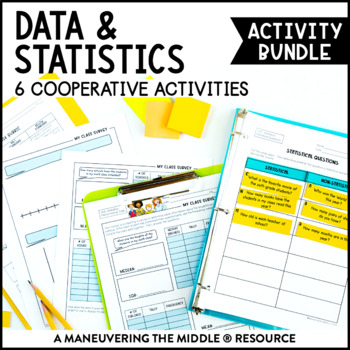
Data & Statistics Activity Bundle | Measures of Center, Histograms, & Box Plots
This Data and Statistics Activity Bundle includes 6 classroom activities to support statistical questions, histograms, box plots, measures of center and measures of variability. These hands-on and engaging activities are all easy to prep! Students are able to practice and apply concepts with these data and statistics activities, while collaborating and having fun! Math can be fun and interactive! Standards: CCSS (6.SP.1, 6.SP.2, 6.SP.3, 6.SP.4, 6.SP.5) and TEKS (6.12A, 6.12B, 6.12C, 6.12D, 6.13
Subjects:
Grades:
5th - 7th
Types:
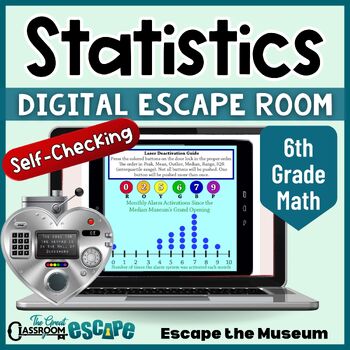
6th Grade Math Data Analysis & Statistics Activity Digital Escape Room Game
Find the median, read the box plot, interpret the frequency table, and unlock the door! This 6th grade math activity based on statistics and probability standards will put your students statistical skills to the test. Your students are volunteer docents at the Median Museum. After the security system locks everyone in, they will need to use their knowledge of statistics to escape the museum. This engaging digital escape room is easy for teachers to implement. The breakout process is fully autom
Subjects:
Grades:
6th - 7th
Types:
6th Grade Math Warm Ups or Daily Review - Google Forms PDFs & Word Versions
You will receive 265 half-page warm ups, aligned and coded with the 6th Grade Common Core Standards! You can buy with confidence! These are best-sellers with over 200 positive ratings!Every standard is covered, with at least 5 warm ups per standard. The standards are displayed on each sheet, and a standard alignment sheet is included. Some standards are so similar that two standards may appear in the same warm up. More complex, dense standards are divided over several different half sheets.
Subjects:
Grades:
6th
Types:
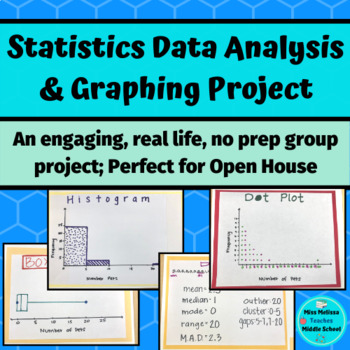
Statistics Project: Data Analysis & Graphing- real life, no prep
This statistics project is intended as a closure for your sixth grade statistics unit and aligns with ALL of the sixth grade statistics and probability common core state standards. In groups, students work together to choose a statistical question to ask the class. Once the class is surveyed, the group works together to create a frequency table, a dot plot, a histogram, and a box and whiskers plot. After creating their graphs, the groups analyze their data by looking at the mean, median, mode ra
Subjects:
Grades:
6th - 7th
Types:
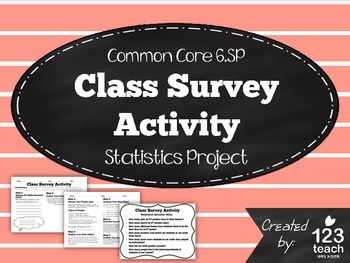
Class Survey Activity - Common Core 6th Grade Statistics Project
This "Class Survey Activity" includes a two page activity aligned to common core standards for statistics and probability (6.SP).
Students will have to come up with a statistical question to survey their classmates. Then, the students will record their results, create a graph, and analyze their data. Lastly, the students will present their results with the class. With my class, I give the students at least a full class period to complete the activity, and then it takes another class perio
Subjects:
Grades:
5th - 7th
Types:
Also included in: Math Assessments and Review Activities BUNDLE for 6th Grade Common Core
6th Grade Statistics and Probability Notes & Activities Unit | Data Sets
Looking for 6th grade guided notes for Statistics and Probability that are designed to help your students thrive and save you the time and energy of writing and designing them yourself? These NO PREP guided notes are a classroom-proven resource that will have your students proficient in entire 6th Grade Math statistics and probability common core standards. With a comprehensive design, these notes offer a structured approach that can be differentiated for every level of learner for the entire u
Subjects:
Grades:
5th - 7th
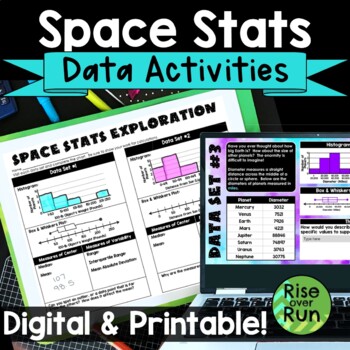
Box and Whiskers Plots and Histograms Activity with Real World Space Statistics
Use statistics for a real world application with this engaging activity about space stats! Students use real data to create histograms, box and whiskers plots, as well as calculate median, mean, range, interquartile range, and mean absolute deviation. This lesson works great for a space room transformation if you choose! Components are included in printable versions for in-person learning and Google Slides + Microsoft PowerPoint for online learning.Here’s what is included:Intro Presentation (Po
Subjects:
Grades:
6th - 9th
Types:
Also included in: Algebra 1 and 8th Grade Math Curriculum Bundle for Entire Year
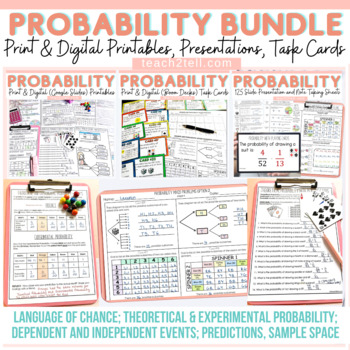
Chance and Probability Activities Theoretical & Experimental Probability Bundle
Are you teaching your students all about chance and probability and looking for fun hands-on probability activities? This print and digital bundle of worksheets, task cards, slideshows and note-taking sheets on Probability will reinforce the understanding of theoretical probability, experimental probability, language of chance, sample space, predictions, lists, tree diagrams, dependent probability events and independent probability events.Both US and British English spelling and terminology file
Subjects:
Grades:
4th - 7th
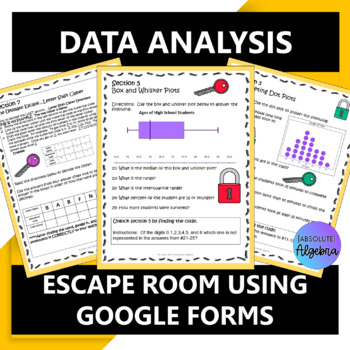
Data Analysis Digital Digital Escape Room using Google Forms
#overtherainbow Data Analysis Digital Escape Room Google FormsGive your students comprehensive practice on data analysis including variability, mean, median, mode, range, IQR, box and whisker, dot, stem and leaf plots, histograms, relative frequency tables, and more! This is a NO PREP Escape Room using technology! Just hand your students the worksheet, give them URL for the google form and they're ready to go!This resource includes:VariabilityMean, Median, Mode, Range, and Interquartile Range (I
Subjects:
Grades:
6th - 7th
Types:
Also included in: Middle School Math Activities Bundle
Statistics Project
This is a survey project that is aligned to the 6th and 7th Grade Common Core (6.SP.1 to 6.SP.5 and 7.SP.1 to 7.SP.4). Students survey a random sample and then calculate the mean, median, range, and mode of the data. They also must create different data displays such as histograms and box and whisker plots. This project is an all encompassing activity that gets students thinking about statistics and loving math! They prove their understanding of the topics by asking questions they are interested
Grades:
6th - 7th
Types:
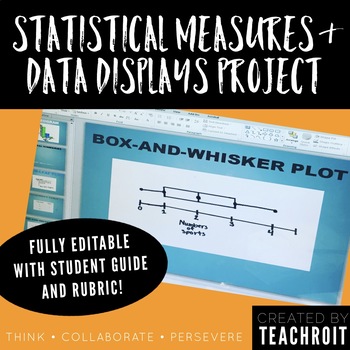
Statistics & Data Display Project for 6th Grade Math PBL (Fully Editable)
This product includes a student guide for a 6th grade middle school mathematics project that will require students to develop a statistical question, conduct a survey with their classmates, create numerical summaries, represent their findings using visual data displays, and finally present their findings! The thorough student guide provides step by step directions for each part of the project and could be used as either an in class project or to be assigned as homework. The student guide also in
Math Enrichment Choice Board Sixth Grade for Ratios Statistics Number System
This resource includes math enrichment choice boards, rubrics, and instructions for every single 6th grade math Common Core State Standard for ratios, proportional relationships, expressions and equations, statistics and probability, geometry, and the number system. These are great for early finishers and students who need enrichment in math. Included in this pack are the math enrichment boards I use for my sixth grade learners who have mastered any of our math concepts and are now ready for a c
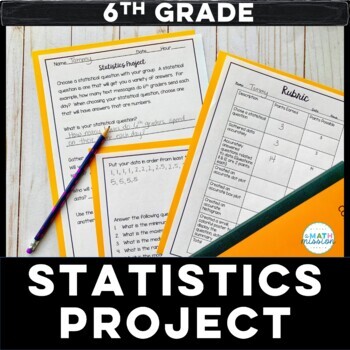
Math Statistics Project Based Learning Dot Plot Box Plot Histogram
Set your students loose to practice their statistics skills! This project is great for a culminating assessment. This project is centered around students coming up with a statistical question, and gathering data on that question. Students answer statistical questions, and create a dot plot, box and whisker plot and histogram based on the data collected. A summary of their findings is then created to display for others to see. A rubric is included for grading purposes. This project actively
Subjects:
Grades:
5th - 7th
Types:
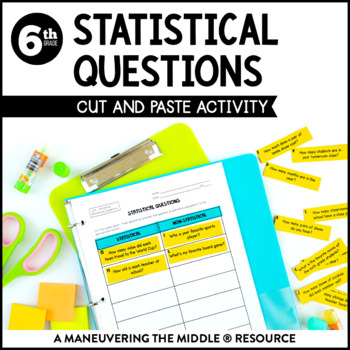
Statistical Questions Activity | Summarizing Categorical Data Activity
This Statistical Questions Cut and Paste is a great for practicing identifying what is and isn't considered a statistical question. Students will determine whether each question provided is statistical or non-statistical and paste them in the appropriate column. This activity is great for extra practice, as a station or center, and can be used to add variety to homework or independent work. Students can be hands-on, while still applying their understanding of statistical questions. Students ar
Subjects:
Grades:
5th - 7th
Types:
CCSS:
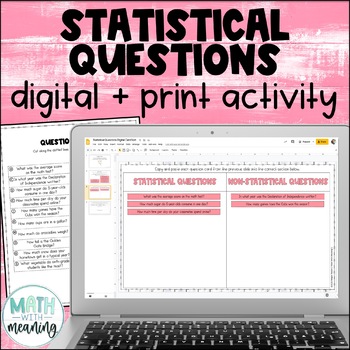
Statistical Questions Digital and Print Card Sort for Google Drive and OneDrive
Looking for an engaging, no-prep activity to practice identifying statistical and non-statistical questions? Students will read 20 questions and determine if they are statistical or non-statistical questions in this fun digital and print card sort activity. They will also choose a topic and write one one of each type of question of their own about that topic.Please view the preview file to make sure that this activity is appropriate for your students.This product includes the following:A link to
Subjects:
Grades:
5th - 8th
CCSS:
Also included in: Middle School Math Digital and Print Activity Bundle Volume 3
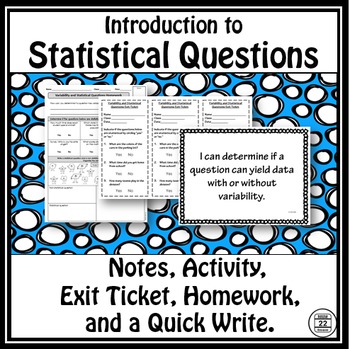
Statistical Questions Notes and Activity
Statistical Questions lesson focuses on questions that yield variability (statistical questions) and questions that do not yield variability It includes guided notes, one activity, an exit ticket, homework, and a quick write. These materials will engage kids as they learn about this important math concept. Answer keys for guided notes and other materials are included.
(1) Guided notes: information that gets straight to the point in easy-to-understand language and visuals.
(2) Activity: Studen
Subjects:
Grades:
6th - 7th
Types:
CCSS:
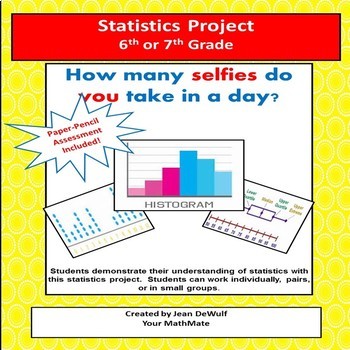
Statistics Project for 6th or 7th Grade! Bonus Assessment Included.
Your students are going to LOVE this interactive Statistics Project!You can choose either paper/pencil or digital formats for this project.Students can work individually, in pairs or in small groups.There are 5 parts to this project: Part I: Creating a Statistical Question Part II: Collecting Data & Determining the Measures of Center, Variation & 5 number summary. Part III: Creating 3 Graphs; a histogram, a dot plot and a box-n-whisker plot. Part IV: Written Description. Students will an
Subjects:
Grades:
6th - 7th
Types:
6th Grade SBAC Math Performance Task (PT) Test Prep Bundle
Student confidence and competence will soar with these low-prep math performance tasks! Math performance tasks give students the opportunity to use problem-solving skills that prepare them for the real world. The tasks in this bundle also prepare students for success with the Smarter Balanced Assessment Consortium (SBAC), the Partnership for Assessment of Readiness for College and Careers (PARCC), the California Assessment of Student Performance and Progress (CAASPP), the State of Texas Assessme
Subjects:
Grades:
6th - 7th
Types:
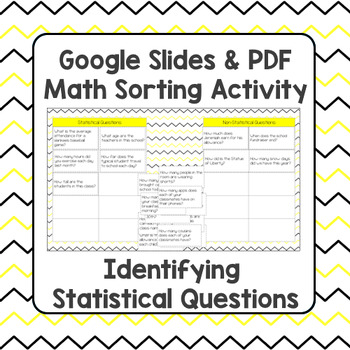
Statistical Question Sort - Digital Google Slides and PDF Versions
Students need to find measures of center and variability, and display data in a variety of ways.This all starts with identifying and asking statistical questions! You will receive 2 versions of this activity: 1 PDF and key, and 1 link to a Google Slides version for Distance Learning! You need a Google account to access the digital version. You can In this sorting activity, students cut out 20 question cards to sort manually, or they drag and drop cards in the digital version to sort in a Goog
Subjects:
Grades:
6th
Types:
CCSS:
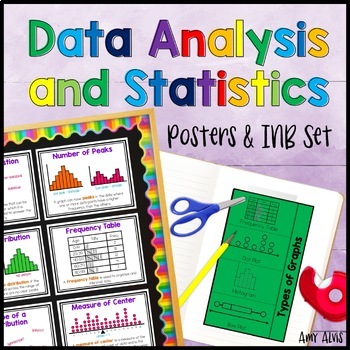
Data Analysis and Statistics Posters and Interactive Notebook INB Set
This poster (anchor chart) and interactive notebook (INB) set covers statistical questions, numerical data, categorical data, frequency table, dot plot, histogram, box and whisker plot, box plot, parts of a box and whisker plot, parts or a box plot, measure of center, spread, shape of distribution, symmetry, number of peaks, skewness, uniform distribution, outlier and gaps. The INB pages cover Types of Graphs, Statistical Questions and Patterns in Data.It includes 3 different interactive foldabl
Subjects:
Grades:
6th - 8th
Also included in: 6th Grade Posters and Interactive Notebook INB BUNDLE Anchor Chart
Common Core Math 6th Grade - Statistics and Probability - CCSS 6.SP
*This product was revised March 6, 2015. If you purchased the resource before this date, go to My Purchases and download the revised version.*
This resource covers the 6th grade domain, Statistics and Probability. There are lessons and activities on statistical questions, dot plots, histograms, box plots, measures of center, measures of variability and other descriptions of the data set.
1st Activity – Teacher Led Activity
Students identify statistical questions. Data will be collected by the
Subjects:
Grades:
6th
Types:
Showing 1-24 of 637 results


