461 results
8th grade graphing interactive whiteboards
Analyzing Data & Interpreting Graphs Digital Task Cards for BOOM Learning BUNDLE
Great for both digital and traditional learning, this bundle contains three decks of twenty-five cards and one deck of nine cards for a total of 84 cards about data analysis and graph interpretation. Line graphs, bar graphs, and pie charts are all included. The question types include typing the correct response, answering True or False, and clicking the correct response.The Boom Decks included in this bundle are listed below:Analyzing Data and Interpreting Graphs Volume 1Analyzing Data and Inter
Subjects:
Grades:
5th - 8th
Coordinate Graphing PowerPoint Lesson
Smile! You're Coordinate Graphing
This 32-slide PowerPoint presentation will have your students mastering how to graph x and y coordinates (2,3) in no time at all! Along with presenter SMILEY FACE, you students will learn how graph coordinate points, how to decide the correct coordinate points when given a point on the graph, and how to find the correct destination when coordinate points are given. Students are given so much opportunity for guided practice and independent practice, that they
Subjects:
Grades:
4th - 8th
CCSS:
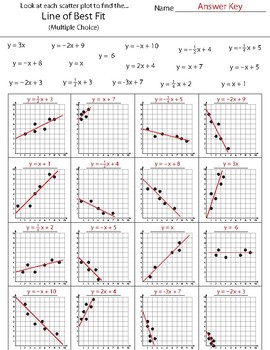
Finding the Line of Best Fit
This worksheet has students looking at scatter plots and trying to come up with the line of best fit. The multiple choice answers are listed at the top to help the students out.
Grades:
7th - 10th
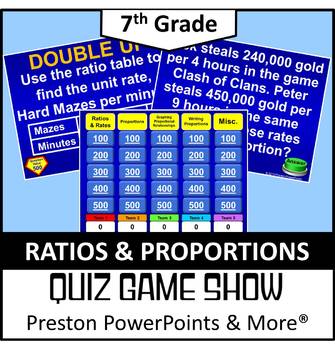
(7th) Quiz Show Game Ratios and Proportions in a PowerPoint Presentation
7th Grade Math Quiz Show Game Ratios and Proportions in a PowerPoint PresentationThis Quiz Show game, Jeopardy Style, is a great way to review a chapter. There are 25 questions and a scoreboard so you don’t have to write the score on a side board. Each page has the point value!This Quiz Show game covers all of the following:Ratios and Rates 7.RP.1, 7.RP.3 Proportions 7.RP.2a, 7.RP.2b, 7.RP.2dWriting Proportions 7.RP.2c, 7.RP.3NEW: The lesson is in an editable format so you can tailor the lesson
Grades:
6th - 8th
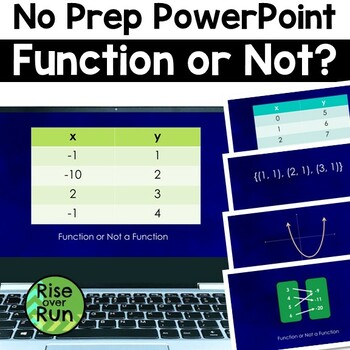
Identifying Functions No Prep PowerPoint Lesson
Use this zero prep PowerPoint to see if your students can correctly identify functions. It includes tables, graphs, ordered pairs, and mapping diagrams.18 slides show a relation and ask "Function or Not a Function?" An answer slide follows each one. This is a great activity to use with white boards, answer cards, or a simply thumbs up/down. You will get immediate feedback based on your students' responses! Perfect for test prep!Check out the preview for more details. Common Core Standard:CCS
Grades:
8th - 9th
CCSS:
Also included in: Identifying Functions Unit with Activities, Notes, Practice, and Test
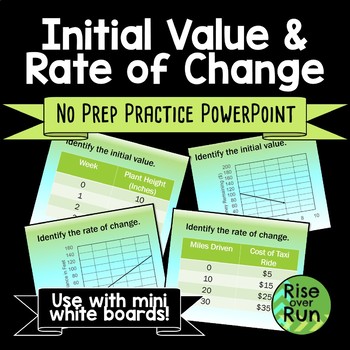
Rate of Change and Initial Value Practice PowerPoint
Use this powerpoint to see if your students can correctly identify initial value and rate of change from tables and graphs.Ten slides show table of values or graph and ask students to find the initial value. Then ten slides ask students to find the rate of change. Clicking each slide again will reveal the answer. Great activity to use with mini white boards! No prep!This activity helps students relate slopes and y-intercepts to real world stories, so they can begin writing equations in the
Grades:
8th - 9th
Also included in: 8th Grade Math Activities & Lessons Bundle for the Whole Year
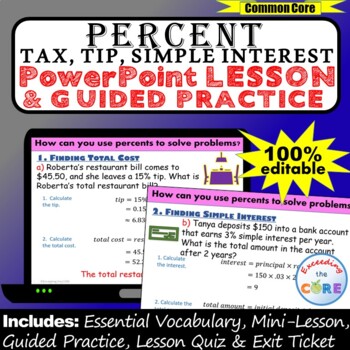
PERCENT TAX, TIP, SIMPLE INTEREST PowerPoint Lesson & Practice | Digital
Great for online learning and distance learning!Get your students successfully using PERCENTS TO CALCULATE TAX, TIPS, AND SIMPLE INTEREST with this PowerPoint Presentation. This lesson begins with a focused mini-lesson and guided practice questions. It concludes with a lesson quiz and exit ticket to assess student understanding. All of the answers are included. This PowerPoint presentation is 100% editable, therefore you can modify any slide as needed.What is Included:_ Mini-Lesson with Guided
Grades:
6th - 8th
CCSS:
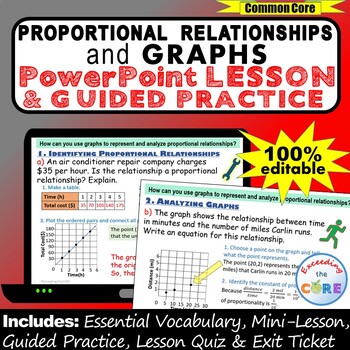
PROPORTIONAL RELATIONSHIPS & GRAPHS PowerPoint Lesson AND Practice - DIGITAL
Great for online learning and distance learning!Get your students successfully analyzing PROPORTIONAL RELATIONSHIPS & GRAPHS with this PowerPoint Presentation. This lesson begins with a focused mini-lesson and guided practice questions. It concludes with a lesson quiz and exit ticket to assess student understanding. All of the answers are included. This PowerPoint presentation is 100% editable, therefore you can modify any slide as needed.What is Included:_ Mini-Lesson with Guided PracticeT
Grades:
6th - 8th
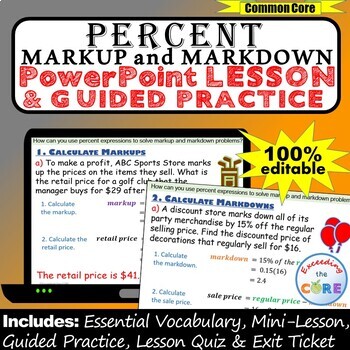
PERCENT MARKUP AND MARKDOWN PowerPoint Lesson AND Guided Practice - DIGITAL
Great for online learning and distance learning!Get your students successfully using PERCENTS TO CALCULATE MARKUPS AND MARKDOWNS with this PowerPoint Presentation. This lesson begins with a focused mini-lesson and guided practice questions. It concludes with a lesson quiz and exit ticket to assess student understanding. All of the answers are included. This PowerPoint presentation is 100% editable, therefore you can modify any slide as needed.What is Included:_ Mini-Lesson with Guided PracticeT
Grades:
6th - 8th
CCSS:
(8th) Functions2 {Bundle} in a PowerPoint Presentation
8th Grade Math (Pre-Algebra) Functions {Bundle} in a PowerPoint PresentationThis is a bundle include the five PowerPoint lessons below and a Quiz Show game, Jeopardy Style, for review.Relations and Functions 8.F.1Representations of Functions 8.F.1Linear Functions 8.F.2, 8.F.3, 8.F.4Comparing Linear and Nonlinear Functions 8.F.3Analyzing and Sketching Graphs 8.F.5Quiz Show Game Functions 8.F.1, 8.F.2, 8.F.3, 8.F.4, 8.F.5These lessons have SKELETON NOTES, notes that have the problem only. I used t
Grades:
7th - 9th
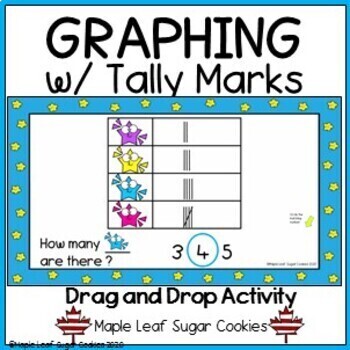
Graphing w/ Tally Marks - Data Management Graphs - Google Slides
Teach graphing and tally marks with this colourful and fun activity. Follow the prompts on each page to identify the number of items in the graphs. Children can drag the circles to the corresponding numbers in order to demonstrate knowledge of counting up tally marks in a graph. Interactive way to teach math skills. Great for interactive whiteboards, whole class lessons, math centres, assessment and Google Classroom.Newly revised: The final few slides have a "Match the Number to the Tally Mark"
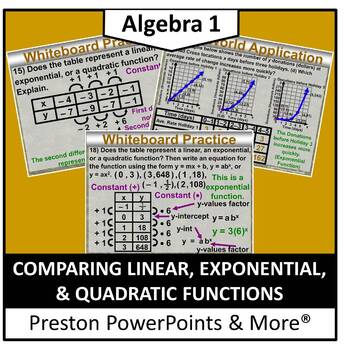
(Alg 1) Comparing Linear, Exponential, and Quadratic Functions in a PowerPoint
Algebra 1 Comparing Linear, Exponential, and Quadratic Functions in a PowerPoint PresentationThis slideshow lesson is very animated with a flow-through technique. I developed the lesson for my Algebra 1 class, but it can also be used for upper level class reviews. This lesson teaches how to identify linear, quadratic, and exponential functions using graphs or tables, compare graphs of linear, quadratic, and exponential functions using graphs or tables, and solve a real-life problem by using f
Grades:
8th - 10th
CCSS:

FAST FOOD FUN: Writing, Graphing & Interpreting INEQUALITIES with two variables
Inequalities with one variable are hard enough for students to grasp, but add another variable and their brains go a little haywire! I wrote this lesson to make sure I could keep my 8th graders' attention while teaching a new and rather difficult concept.
What better way than through their tummies! ;-)
The lesson covers writing an inequality from a trip to a fast food restaurant with your friends. After writing the inequality, the students should discuss the parts of their inequality and how
Subjects:
Grades:
7th - 10th
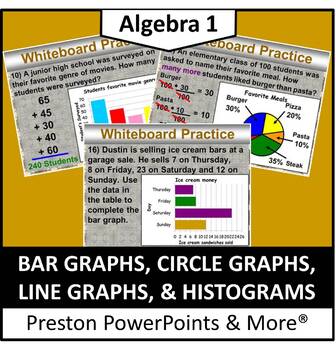
Bar Graphs, Circle Graphs, Line Graphs, & Histograms in a PowerPoint
Bars Graphs, Circle Graphs, Line Graphs, & Histograms in a PowerPoint PresentationThis slideshow lesson is very animated with a flow-through technique. I developed the lesson for my Algebra 1 class, but it can also be used for lower level classes. This lesson teaches how to interpret bar graphs, line graphs, circle graphs and histograms, create bar graphs, line graphs, circle graphs and histograms, use tables to organize data and solve problem, & use graphs to organize and solve real-l
Grades:
5th - 9th
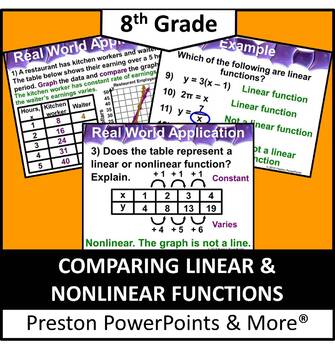
(8th) Comparing Linear, Nonlinear, and Rate Functions in a PowerPoint
8th Grade Math Comparing Linear and Nonlinear Functions in a PowerPoint PresentationThis slideshow lesson is very animated with a flow-through technique. I developed the lesson for my 8th grade class, but it can also be used for upper level class reviews. This lesson teaches how to identify linear and nonlinear functions form tables or graphs, and compare linear and nonlinear functions. It also compares rate functions.This lesson has SKELETON NOTES, notes that have the problem only. I used thi
Grades:
7th - 9th
CCSS:
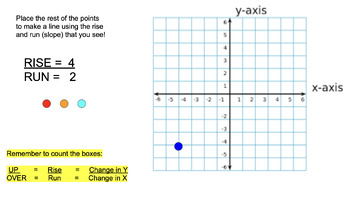
Coordinate Plane, Slope, Rise/Run, Graphing - Online No Prep Bundle
A bundle of activities which can be used as formal lessons or independent practice. Great for Google Classroom or Smart-boards! Also can be used as sub plans! Created by a Special Education Math Teacher to help students become comfortable with graphing!
Grades:
5th - 12th
(8th) Quiz Show Game Linear and Proportional Relationships in a PowerPoint
8th Grade Math (Pre-Algebra) Quiz Show Game Linear and Proportional Relationships in a PowerPoint PresentationThis Quiz Show game, Jeopardy Style, is a great way to review a chapter. There are 25 questions and a scoreboard so you don’t have to write the score on a side board. Each page has the point value!This Quiz Show game covers all of the following:Graphing Linear Equations 8.EE.5Slope of a Line 8.EE.6Graphing Proportional Relationships 8.EE.5, 8.EE.6This Review lesson applies to the Commo
Grades:
7th - 9th
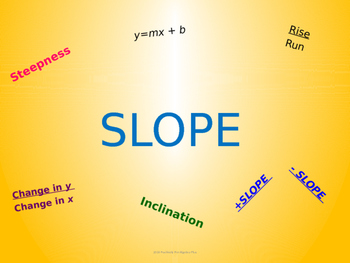
Slope PowerPoint Lesson - Distance Learning
This 25-page PowerPoint lesson covers multiple aspects of slope including: • Defining slope • Describing slope as positive, negative, zero, and undefined • Finding the slope given a graph using rise over run • Drawing lines given two points • Drawing lines given a point and the slope • Calculating slope given two points • Finding the slope of the sides of polygons graphed on the coordinate planeThe lesson starts by having students draw a picture using
Subjects:
Grades:
7th - 9th
Also included in: Middle School Math PowerPoint Bundle - Distance Learning

Geometry PowerPoint Unit Bundle | Triangles & Similarity DISTANCE LEARNING
Teachers, save yourself time creating lessons! This fully editable PowerPoint bundle of seven lessons is professionally designed and teaches students the important skills related to triangles and similarity. This bundle includes seven lessons for a total of 44 animated slides encouraging continued student engagement.Essential Skills from this unit:determine whether three given side lengths can form a trianglesknow and be able to use the Triangle Sum Theorem, Isosceles Triangle Theorem, Hinge The
Grades:
8th - 10th
CCSS:
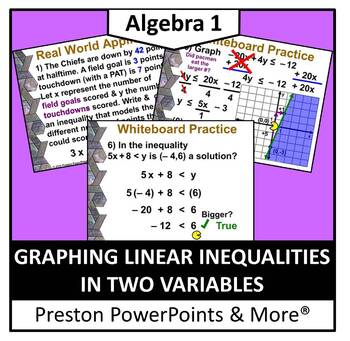
(Alg 1) Graphing Linear Inequalities in Two Variables in a PowerPoint
Algebra 1 Graphing Linear Inequalities in Two Variables in a PowerPoint PresentationThis slideshow lesson is very animated with a flow-through technique. I developed the lesson for my Algebra 1 class, but it can also be used for upper level class reviews. This lesson teaches how to tell whether an ordered pair is a solution of an inequality, write an inequality in slope-intercept form, graph a linear inequality with two variables, and solve a real-life situation by modeling linear inequalities
Grades:
8th - 11th
CCSS:

Geometry PowerPoint Unit Bundle | Tools of Geometry DISTANCE LEARNING
Teachers, save yourself time creating lessons! This fully editable PowerPoint bundle of six lessons is professionally designed and teaches students the important foundations of Geometry. This bundle includes six lessons for a total of 59 animated slides encouraging continued student engagement.Essential Skills from this unit:sketch using appropriate markingsinterpret sketches and markingsunderstand accurate definitionsunderstand the relationships between basic angle pairsapply algebra to interpr
Grades:
7th - 10th
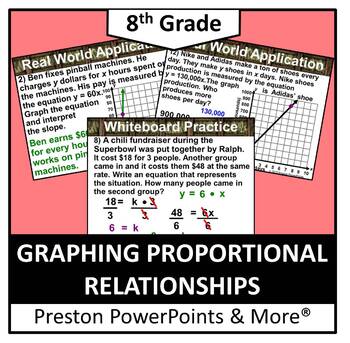
(8th) Graphing Proportional Relationships in a PowerPoint Presentation
8th Grade Math (Pre-Algebra) Graphing Proportional Relationships in a PowerPoint PresentationThis slideshow lesson is very animated with a flow-through technique. I developed the lesson for my 8th grade class, but it can also be used for upper level class reviews. This lesson teaches how to write and graph proportional relationships, find the constant of variation, and solve real-life situations by interpreting slope as a constant of variation like in the parachute problem.This lesson has SKEL
Grades:
7th - 9th
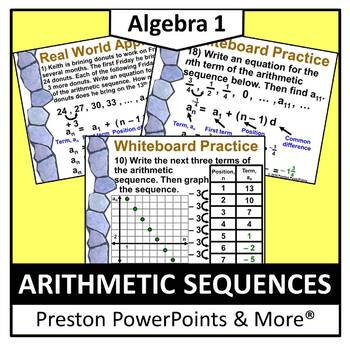
(Alg 1) Arithmetic Sequences in a PowerPoint Presentation
Algebra 1 Arithmetic Sequences in a PowerPoint PresentationThis slideshow lesson is very animated with a flow-through technique. I developed the lesson for my Algebra 1 class, but it can also be used for upper level class reviews. This lesson teaches how to extend and graph arithmetic sequences, write equations for arithmetic sequences, and solve real-life situations by using arithmetic sequences to find how many donuts a coworker is bringing for Friday.This lesson has SKELETON NOTES, notes th
Grades:
8th - 10th
CCSS:
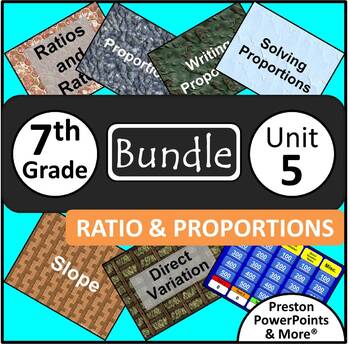
(7th) Ratios and Proportions {Bundle} in a PowerPoint Presentation
7th Grade Math Ratios and Proportions {Bundle} in a PowerPoint PresentationThis is a bundle include the six PowerPoint lessons below and two Quiz Show games, Jeopardy Style, for review.Ratios and Rates 7.RP.1, 7.RP.3 Proportions 7.RP.2a, 7.RP.2b, 7.RP.2dWriting Proportions 7.RP.2c, 7.RP.3Quiz Show Game Ratios and Proportions 7.RP.1, 7.RP.2, 7.RP.3Solving Proportions 7.RP.2b, 7.RP.2cSlope 7.RP.2bDirect Variation 7.RP.2a, 7.RP.2b, 7.RP.2c, 7.RP.2dQuiz Show Game Proportions and Slopes 7.RP.2a, 7.R
Grades:
6th - 8th
Showing 1-24 of 461 results


