1,126 results
8th grade graphing resources for Microsoft PowerPoint
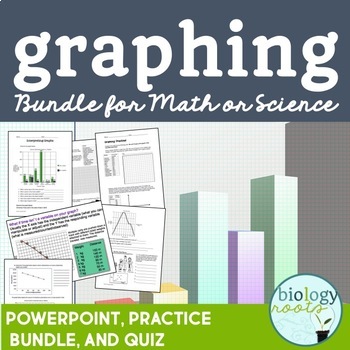
Graphing Bundle for Secondary
Complete and editable graphing bundle includes plenty of practice, editable PowerPoint notes to introduce or reinforce graphing concepts, as well as an assessment to finish it off! Suitable for grades 7 and up. Included in the package is:1. How to Interpret Graphs PowerPoint PresentationCovers line graphs, bar graphs, scatter plots and pie charts. Answers included on teacher version.Student notes included (PDF and PPT). 2. Interpreting Graphs- 3 pages of graph interpretation in which students an
Subjects:
Grades:
6th - 10th
Algebra 1 Curriculum - Full Year EDITABLE Unit Plans | Bundled for Common Core
This is a great bundle that covers concepts for a full year Algebra 1 course! 76 lessons are included! Documents are EDITABLE!Included:- Overview of the common core alignment tandards (Two 18-week guides) (PDF and Word) - Overview of the common core alignment (PDF)- Guided notes for 76 lessons (PDF and Word)- PowerPoint presentations (aligned with guided notes) (PPTX)-10 Mid-unit quizzes (PDF and Word)-10 Unit tests (PDF and Word)-2 Semester exams (PDF and Word)Each lesson contains a learning
Grades:
8th - 12th
CCSS:
Data Tables and Graphing Introduction and Practice
Students need practice creating data tables and graphs. Students also need to be able to interpret existing graphs. This lesson introduces students to data tables and graphs, teaches students how to create data tables from data, how to interpret tables and graphs, and offers hands-on opportunities to create data tables and graphs.
A 29-slide Power point presentation introduces data tables and graphing skills, offered in both 2003 and 2007 versions of Power point. Accompanying work pages in P
Subjects:
Grades:
5th - 8th
Geometry PowerPoint Lessons for the Entire Year BUNDLE
Teachers, save yourself time creating lessons! These fully editable PowerPoint lessons are professionally designed and teach students the important concepts throughout the Geometry course. Each lesson has 3-20 slides which are animated for continued student engagement.Why purchase the bundle?You get the best deal! You pay $60 for what is worth $96! BIG SAVINGS!Teaching virtually? Face to face? Both?Record your voice directly onto the slides and send the file to your students to watch at home as
Grades:
8th - 10th
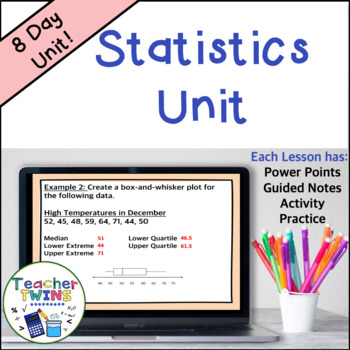
Statistics Unit - Mean Absolute Deviation - Populations and Samples - Box Plots
Make lesson planning easy with this no-prep Statistics - Mean Absolute Deviation - Populations and Samples - Box-and-Whisker Plots Unit! Included are 8 ready-made lessons to teach finding mean absolute deviation as well as interpreting and creating box-and-whisker plots. This unit is very easy to use and will save you a lot of time! Your students will learn how to find mean absolute deviation and interpret box-and-whisker plots by using our editable PowerPoints with guided notes. Students will l
Subjects:
Grades:
6th - 8th
Also included in: 7th Grade Math Curriculum Bundle
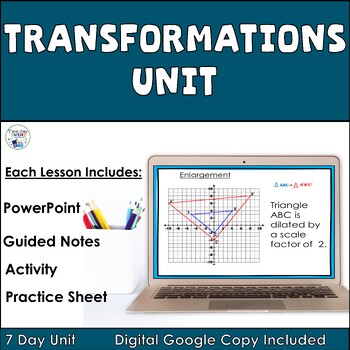
Transformations (Reflections, Rotations, Translations, Dilations) 8th Grade Unit
Make lesson planning easy with this no prep Transformations - Reflections, Rotations, Translations, and Dilations Unit! Included are 7 ready-made lessons to teach reflections, rotations, translations and dilations to your students. This unit is very easy to use and will save you a lot of time!Teach your students about reflections, rotations, translations and dilations by using our editable PowerPoints with guided notes. Students will love learning about transformations when you use the included
Grades:
6th - 8th
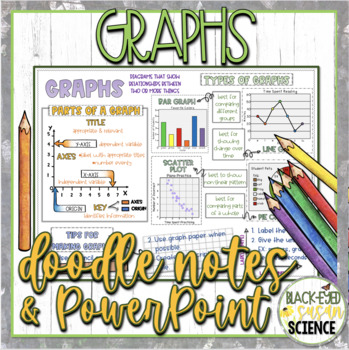
Graphs Doodle Notes & Quiz + Power Point
-DIFFERENTIATED CONCEPT NOTES -QUIZ -ANSWER KEYS -RIGOROUSDo your students love to doodle while taking notes? Don't fight it, embrace it with Doodle Notes (aka Squiggle Sheets)!!!These notes are not only fun but help students to meet Next Generation Science Standards.Notes are differentiated. 3 versions are included. Use the included answer key or choose to use the blank version to make the notes your own.Some things covered in these notes:parts of graphstipstypes of graphsbarlinecirclescatter
Grades:
6th - 8th
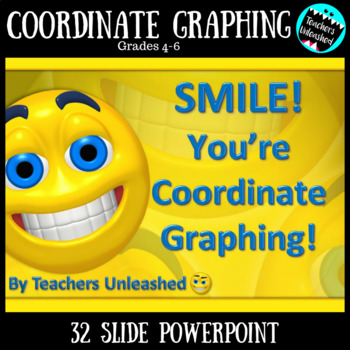
Coordinate Graphing PowerPoint Lesson
Smile! You're Coordinate Graphing
This 32-slide PowerPoint presentation will have your students mastering how to graph x and y coordinates (2,3) in no time at all! Along with presenter SMILEY FACE, you students will learn how graph coordinate points, how to decide the correct coordinate points when given a point on the graph, and how to find the correct destination when coordinate points are given. Students are given so much opportunity for guided practice and independent practice, that they
Subjects:
Grades:
4th - 8th
CCSS:
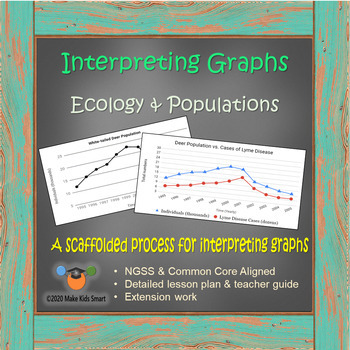
Interpreting Graphs - Ecology & Populations (17 slide Distance Learning Packet)
Teach students how to analyze and interpret line graphs, describe trends, and discuss data using a proven 5-step process. This is 2-3 periods of work suitable for distance learning and meant to move gradually from teacher led to independent work.All materials are found within this 17 page editable power point which is suitable for distance learning. Slides can be shared individually for student completion or shared as a full packet.Please check the preview to see exactly what you are downloading
Subjects:
Grades:
6th - 12th
NGSS:
HS-LS2-7
, MS-LS2-2
, MS-LS2-5
, HS-ESS3-2
, MS-LS2-4
...
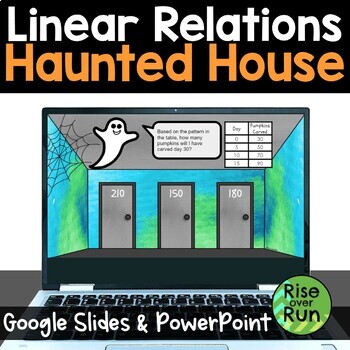
Digital Linear Relationships Halloween Escape Room Activity
Students will love this engaging practice activity for linear relationships. They must try to escape a haunted house! Includes Google Slides and PowerPoint versions. They are given 14 problems to solve, choosing from 3 possible answers for each one. If they solve correctly, they will choose the correct door and avoid the scary giant spiders! If they make a mistake, a spider appears, and they are prompted to try again. Problems include linear graphs, table of values, equations, and stories. Thi
Grades:
7th - 9th
Types:
CCSS:
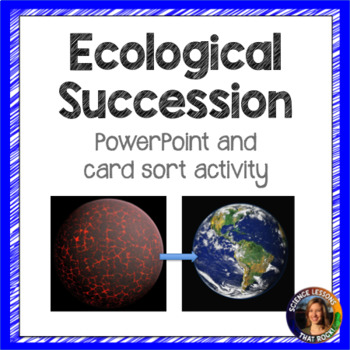
Ecological Succession
In this lesson, students will learn about ecological succession and the differences between primary and secondary succession. Included in your purchase:- An 18 slide powerpoint presentation - A 3 page card sorting activity (both printable PDF version and digital Google slide version included)- A guided YouTube lesson that walks students through the powerpoint. Great for blended learning, flipped classroom models, or absent students.You might also be interested in:Ecological succession timeline a
Subjects:
Grades:
8th - 10th
Types:
Also included in: Ecology Bundle
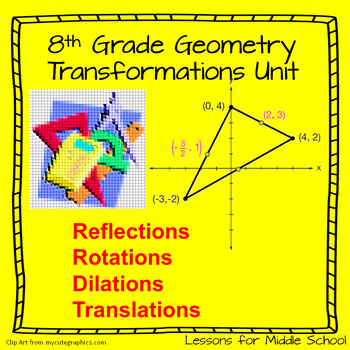
8 Grade Math - Reflections, Translations, and Rotations Geometry Unit
This is a COMPREHENSIVE unit for teaching students all of the 8th Grade Geometry COMMON CORE STATE STANDARDS associated with Dilations, Translations, Reflections, and Rotations. ABSOLUTELY NO PREP REQUIRED, just download and start teaching in minutes. This lesson is part of our Geometry Bundle for 8th grade that includes 9 weeks of lessons.LESSONS INCLUDED➯2 Lessons on Translations➯4 Lessons on Reflections➯6 Lessons on Rotations➯1 Review Lesson➯1 Dilations Project➯3 Formative Assessments*****
Subjects:
Grades:
7th - 9th
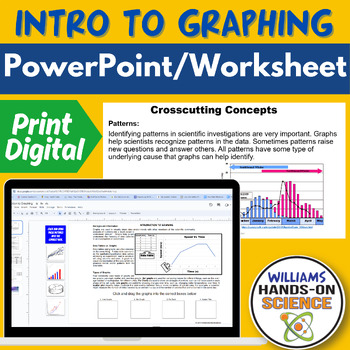
NGSS Intro to Graphing Crosscutting Concepts Science & Engineering Practices
If you are teaching your students how to understand graphs and want to hit NGSS Science and Engineering Practices and Crosscutting Concepts, this resource is a great scaffold or lecture! This resource is great as a warm up/bell ringer, lecture, homework or sub plan.This resource includes the following:-Student Handout-Key-Editable PowerPoint for lecture and/or scaffold This resource includes the following Concepts:-Interpreting Graphs-How to make a graph-Difference between data tables and graph
Subjects:
Grades:
6th - 12th
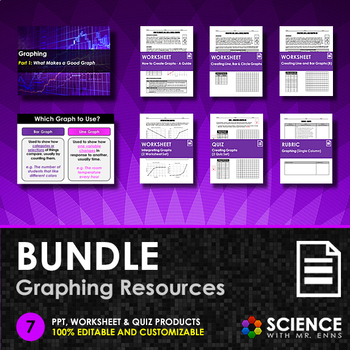
Graphing Skills or Making Graphs Unit Bundle on Line, Bar, and Circle Graphs
This bundle contains 7 graphing resources that forms a suite of products designed to teach graphing skills to middle school and early high school students.Graphing Skills Addressed:Identifying when to use a line, bar, or circle graph based on dataCreating line graphsCreating bar graphsCreating circle graphsDrawing lines of best fitInterpreting graphs (positive, negative, and no correlation)Bundle Contents:PPT - Graphing Skills (WITH SUMMARY NOTES)Worksheet - How to Create Line, Bar and Circle Gr
Subjects:
Grades:
7th - 9th
CCSS:
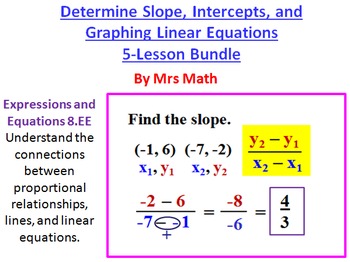
Slope, Intercepts, and Graphing Linear Equations Power Point 5 Lesson Pack
PDF and Microsoft word versions included.Are you looking for an all inclusive package that has everything you need to teach finding the slope, intercepts, and graphing equations? This is it! Lesson Power Points, classworks, homeworks, quizzes, a set of test questions, and even some teaching tips embedded in the lesson for instruction. If you are teaching this topic from scratch these resources will be a lifesaver. They can also be an excellent supplement to the resources you are already usin
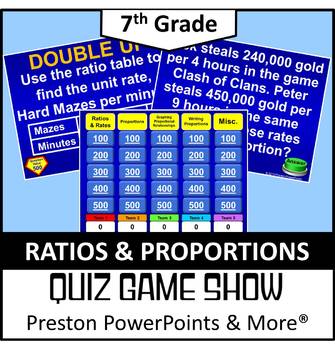
(7th) Quiz Show Game Ratios and Proportions in a PowerPoint Presentation
7th Grade Math Quiz Show Game Ratios and Proportions in a PowerPoint PresentationThis Quiz Show game, Jeopardy Style, is a great way to review a chapter. There are 25 questions and a scoreboard so you don’t have to write the score on a side board. Each page has the point value!This Quiz Show game covers all of the following:Ratios and Rates 7.RP.1, 7.RP.3 Proportions 7.RP.2a, 7.RP.2b, 7.RP.2dWriting Proportions 7.RP.2c, 7.RP.3NEW: The lesson is in an editable format so you can tailor the lesson
Grades:
6th - 8th
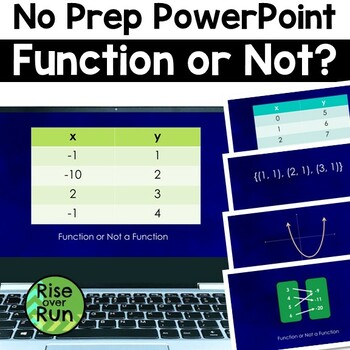
Identifying Functions No Prep PowerPoint Lesson
Use this zero prep PowerPoint to see if your students can correctly identify functions. It includes tables, graphs, ordered pairs, and mapping diagrams.18 slides show a relation and ask "Function or Not a Function?" An answer slide follows each one. This is a great activity to use with white boards, answer cards, or a simply thumbs up/down. You will get immediate feedback based on your students' responses! Perfect for test prep!Check out the preview for more details. Common Core Standard:CCS
Grades:
8th - 9th
CCSS:
Also included in: Identifying Functions Unit with Activities, Notes, Practice, and Test
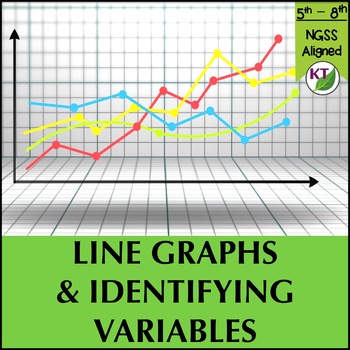
How to Identify Variables and Make a Line Graph Bundle
This is the second lesson from an introduction unit on analyzing and interpreting data from research or experiments. In this lesson, students will set up line graphs to display data: - Independent variable on the x-axis- Dependent variable on the y-axis- Choosing a reasonable scale- Creating a title for the line graph- Creating axis titles and labelsThis download includes: Identifying Variables PowerPoint presentation: Editable .pptx and Google Slides versions (12 content slides)Line Graphs Powe
Subjects:
Grades:
5th - 8th
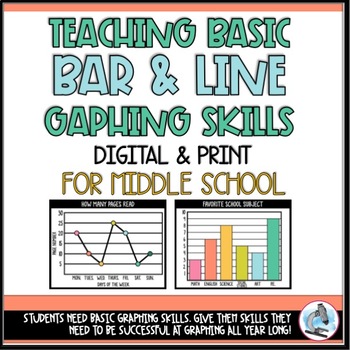
Teach Basic Bar & Line Graphing in Science for Middle School
If I had to guess, your middle school students really struggle with even the most basic graphing in science. I’m right, huh? I’ve got you! Don’t spend another minute stressing over why your students have poor graphing skills! This resource teaches five things all graphs need, plus when to use a bar graph vs a line graph. This resource is complete with a PowerPoint, guided notes, digital student notebooks, and practice graphs that will help your students succeed at graphing in science… and keep
Subjects:
Grades:
5th - 8th
Also included in: Teaching Bar and Line Graph Basics Bundle
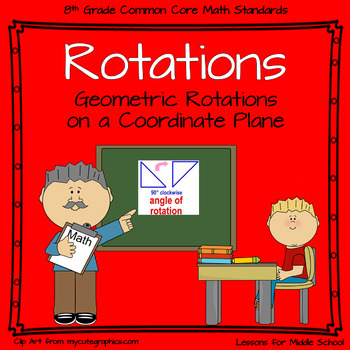
Rotations - Transformation in 8th Grade Geometry
This is a collection of 6 Lessons with accompanying activities and practice worksheets to teach students the concepts of Rotations in the 8th Grade Common Core Math Standards with a focus on GeometryOnce you download this unit, you will not have to do anything except make copies for your students and guide them through the lessons, guided notes, practice problems, activities, and projects. The complete bundle for Transformations can be found here:8th Grade Geometry - Transformations Bundle*****
Subjects:
Grades:
6th - 9th
Also included in: 8th Grade Math Geometry Bundle 9+ weeks

Slope Digital Math Escape Room Activity for Halloween
Students will love this fun practice activity for calculating slope between 2 points. Answering correctly will help them escape a haunted house! Includes Google Slides and PowerPoint versions. They are given 14 problems to solve, choosing from 3 possible answers for each one. If they solve correctly, they will choose the correct door and avoid the scary giant spiders! If they make a mistake, a spider appears, and they are prompted to try again. For each problem, students are given two ordere
Grades:
7th - 9th
Types:
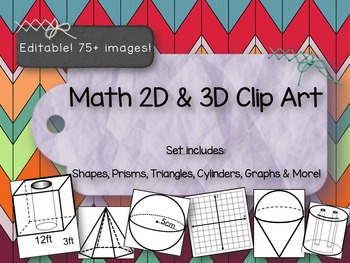
Clip Art Shapes -2D & 3D Prisms, Graphs, Cylinders and more! PPT File
One of the teachers at my school was having trouble finding some 3D geometric shapes to make her test with, so I made a few for her. Then one thing led to another, and now I have a whole bunch of clip art that I thought a Math teacher might find useful. I have used these images to create tests, task cards, scavenger hunts, and practice work for Math small group and centers.
This file is not meant to be used as a presentation. The idea is that you can copy/paste whatever you need from here a
Subjects:
Grades:
5th - 10th
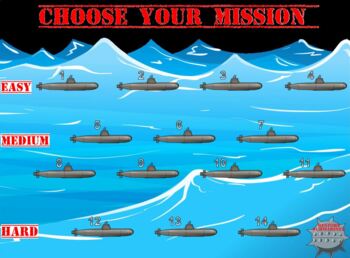
Coordinate Battleship for Graphing Ordered Pairs
UPDATES:Thank you for your feedback! Based on your suggestions, I've made the following changes for this version (version 2):1. You can now choose between EASY, MEDIUM, and HARD modes. For easy mode there are no gaps between hits. For medium mode there are gaps but the hits are evenly spaced. For hard mode, hits are randomly spaced.2. There's now a button that will reveal/hide submarines. You can use this as another tool for hints to students or you can reveal the submarine once students
Grades:
6th - 10th
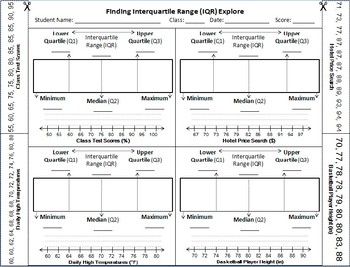
Finding and Comparing Interquartile Range (IQR)
This activity is designed for Texas TEKS listed below. Students use strips of data to fold into 'quartiles' and calculate the IQR.
represent numeric data graphically, including dot plots, stem-and-leaf plots, histograms, and box plots.[6.12A]
interpret numeric data summarized in dot plots, stem-and-leaf plots, histograms, and box plots.[6.13A]
compare two groups of numeric data using comparative dot plots or box plots by comparing their shapes, centers, and spreads.[7.12A]
Subjects:
Grades:
6th - 8th
Showing 1-24 of 1,126 results


