134 results
8th grade graphing resources for SMART Notebook
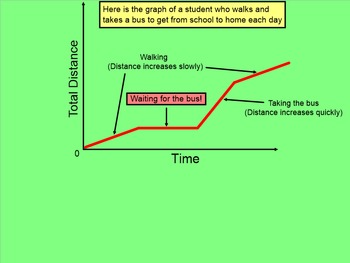
How I Teach Relating Graphs To Events
This is a 25 page Smartboard file describing how to graph situation on a coordinate graph according to different events. The lesson describes what situations make a line go up, go down, or stay horizontal. Sometimes the students have to graph the situation and sometimes the students have to write a story that matches a given graph. I also have a worksheet that goes with this.
Subjects:
Grades:
6th - 9th
Types:
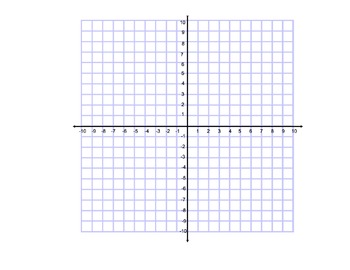
Blank Coordinate Grid
Blank Coordinate grid with all quadrants labeled -10 to 10. Grid is locked in place, though it can be edited. Great for lessons with transformations, or for student who have trouble locating points on a coordinate grid. **Smart Notebook File**Looking for a Google Version? Check out my Google Slides Coordinate Plane for Interactive Notebooks!
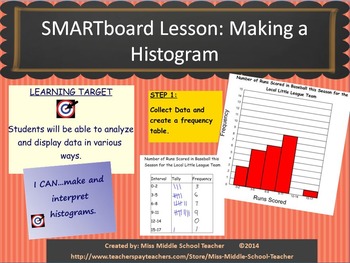
Smartboard Lesson: Histogram Creation
Smartboard Lesson on How to Create a Histogram by Miss Middle School Teacher
Learning Target: Students will be able to analyze and display data in various ways.
I Can: create and analyze a histogram.
This is a 21 slide lesson introducing students to graphing and graph analysis. The following components are covered in this lesson:
1) What is a histogram?
2) What is the purpose of a histogram?
3) How do I make a histogram? (this takes students through histogram creation using a step-by-step ap
Grades:
5th - 10th
Types:
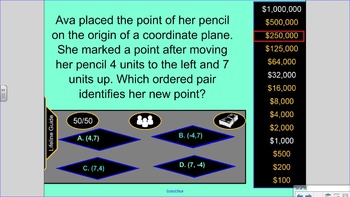
Who Wants to be a Millionaire 6th Grade Math Review VA SOL 6.3, 6.10, 6.12, 6.11
Who Wants to be a Millionaire 6th Grade Math Review VA SOL 6.3, 6.10, 6.12, 6.11. Contains 2 rounds.
SOL 6.3- Integers and Absolute Value
SOL 6.10- Area, Perimeter, and Circumference
SOL 6.12- Quadrilaterals
SOL 6.11- Coordinate Planes
Grades:
6th - 8th
Types:
Also included in: Math 6 Virginia SOL Review Games Bundle (old standards)
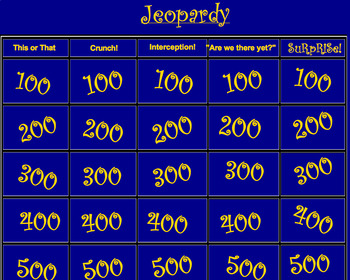
Lines and Slope Jeopardy Review Game
This Jeopardy Smartboard game assesses the following skills
- types of lines (vertical, horizontal, positive and negative slope) and their equation formats
- calculating slope given two points
- finding x and y intercepts
- determining whether or not a point is on a line
About my Products:
While the PARCC assesses many of the mathematical practice standards, I aim to create many problems and activities that require students to apply the skills outlined in the performance level descriptors. I b
Grades:
3rd - 12th, Higher Education, Adult Education, Staff
Types:
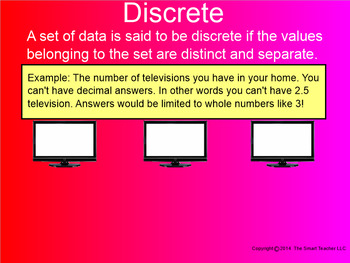
How I Teach Discrete or Continuous Graphs
This is a 33 page Smartboard file explaining the difference between Discrete and Continuous. Students learn that Discrete data is counted and that Continuous data is measured. Students practice by seeing short situations and by looking at the coordinate plane. There are many examples with answers.
Subjects:
Grades:
7th - 10th
Types:
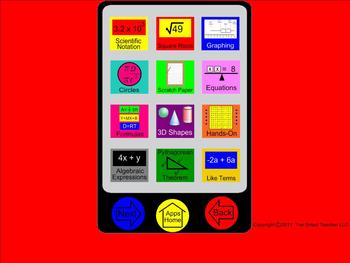
8th Grade Math Teachers Edition Smartboard Bundle
Have you ever wished you could have a teachers edition book on the Smartboard? Now you can! I have created a 277 page Smartboard Lesson that basically puts your teachers edition book on the wall. This file contains practice for Pythagorean Theorem, Nets, 3D Shapes, Algebraic Expressions, and much more. The layout has been designed similar to a smartphone where the homepage acts like a navigational tool to take you to the specific skills you desire. You can be redirected to the homepage from anyw
Subjects:
Grades:
6th - 10th, Staff
Recognize Proportional Relationships
Common Core Standard 7.RP.2.a
Decide whether two quantities are in a proportional relationship, e.g., by testing for equivalent ratios in a table or graphing on a coordinate plane and observing whether the graph is a straight line through the origin.
Use the following Smart Board pages as a center, as an alternate teaching format for small groups or 1:1, or as formative or summative assessment.
You can also print and laminate the pages to use with dry erase markers for discrete t
Subjects:
Grades:
6th - 8th
CCSS:
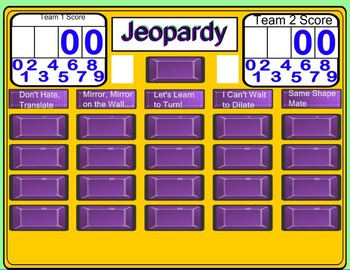
Transformation Jeopardy (Middle School)
Split the class into teams and let them compete against each other as they practice key transformation concepts. Students will work through the concepts of translations, reflections, rotations, dilations and similar figures. Students will be asked to perform transformations, identify transformations given a graph as well as identify new coordinates after a transformation without a graph. There are 5 categories in this Smart Notebook game with 4 questions per category. Each slide has the answ
Grades:
7th - 8th
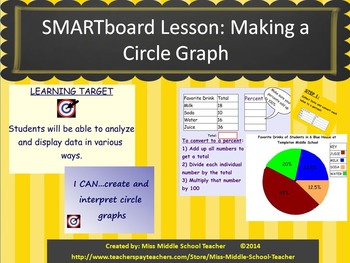
Smartboard Lesson: Circle Graph Creation
Smartboard Lesson on How to Create a Circle Graph by Miss Middle School Teacher
Learning Target: Students will be able to analyze and display data in various ways.
I Can: create and analyze a circle graph.
This is a 24 slide lesson introducing students to graphing and graph analysis. The following components are covered in this lesson:
1) What is a circle graph?
2) What is the purpose of a circle graph?
3) How do I make a circle graph? (this takes students through circle graph creation using
Grades:
5th - 10th
Types:
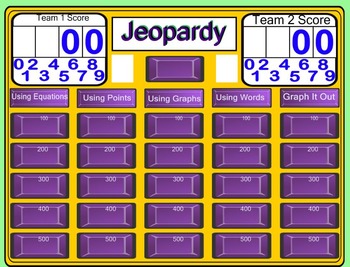
Slope and Y-Intercept Jeopardy
Divide your class into teams and let them compete as they review the concepts of linear equations! This interactive Smart Notebook file has 5 categories with 5 questions per category. The questions ask students to find the slope and y-intercept of linear equations given equations, tables, graphs, word problems or to construct a graph given an equation. All questions have the answer hidden on the slide to make checking answers or revealing work to the class quick and easy! Sit back and relax
Subjects:
Grades:
7th - 9th
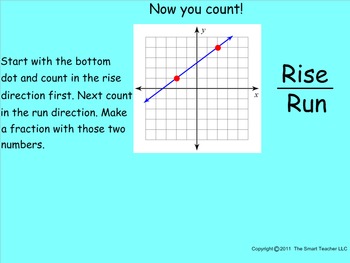
How I Teach Slope Part 2
This is a 40 page Smartboard lesson covering slope. This lesson picks up where part 1 leaves off. The student learns to use rise over run to build answers according to a graphed line. The first several answers already have 2 points plotted for the students. The lesson then progresses to where the students have to plot 2 points on their own. the points are off to the side and the teacher can have students come up to the board for some interaction. All pages include answers.
Grades:
7th - 10th
Types:
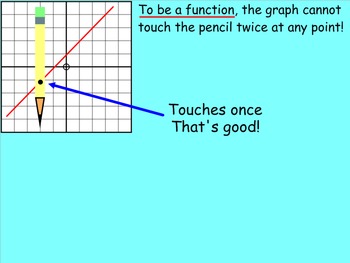
How I Teach Functions (Vertical Line Test)
This is a 27 page Smartboard file explaining how to determine if a relationship (graph) is a function or not. I explain the process and then have several interactive pages where the students or teacher can drag across a pencil to prove their answer. All of those pages include answers. At the end of the lesson the students get to come to the board and make their own graphs.
Grades:
8th - 10th
Types:
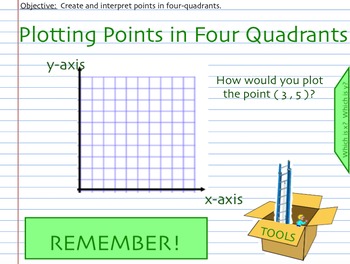
Plotting Points in Four Quadrants
In this interactive SMART Board lesson, students will learn how to plot points in all four quadrants. Students will also investigate the characteristics of points in various locations of the coordinate place (in each quadrant and on each axis). The notebook file also includes notes to the teacher that explains how to use each slide of the presentation and gives suggestions for its delivery.
Grades:
5th - 8th
CCSS:
Box and Whisker Plots Smartboard Slides Lesson Step by Step How to Constuct
Math Teachers ~ You'll LOVE this GREAT Smartboard-Slides-LESSON that teaches students step-by-step how to construct a Box-and-Whisker-Plot; Least/Greatest Value, Lower/Upper Quartile, Median, and how to Find the Interquartile and Range. 37 slides in all! Your students will LOVE this smartboard lesson. WARNING: You MUST have SMART Technologies SMART software, and a SMARTBOARD to teach from, to effectively download, open and use this Interactive Smartboard Lesson. Go to https://legacy.smarttech.co
Subjects:
Grades:
5th - 8th, Staff
Also included in: Box & Whisker Plots Smartboard Slides Notes Worksheet BUNDLE
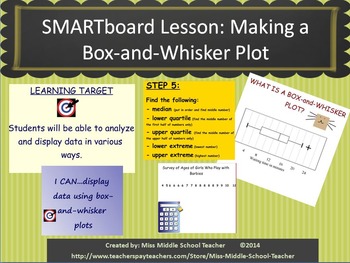
Smartboard Lesson: Box and Whisker Plot Creation
Smartboard Lesson on How to Create a Box and Whisker Plot by Miss Middle School Teacher
Learning Target: Students will be able to analyze and display data in various ways.
I Can: create and analyze a box and whisker plot.
This is a 22 slide lesson introducing students to graphing and graph analysis. The following components are covered in this lesson:
1) What is a box and whisker plot?
2) What is the purpose of a box and whisker plot?
3) How do I make a box and whisker plot? (this takes stud
Grades:
5th - 10th
Types:
How I Teach Linear and Nonlinear Functions
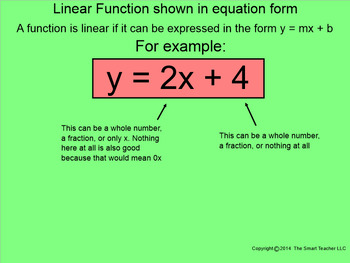
This is a 33 page Smartboard lesson explaining how to identify functions as linear and nonlinear. Students see 3 different types of functions. Functions as equations, functions graphically, and functions in a table. All have various types and styles and all examples have answers.
Subjects:
Grades:
7th - 10th
Types:
How I Teach Slope Part 4
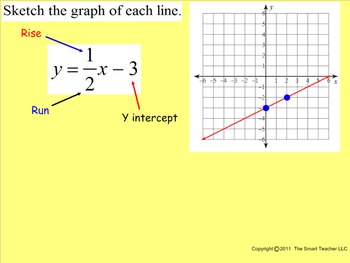
This is a 48 page Smartboard lesson on how to graph linear equations. All types of linear equations are explained here. There are slopes that are fractions and slopes that are whole numbers. Sometimes the y intercept is missing and other times there is zero slope. There are plenty examples to work with and all contain the answer. Students have a graph and a dot so that they are able to plot a couple of points and then connect them to graph the linear equation.
Grades:
7th - 10th, Higher Education
Types:
How I Teach Writing Inequalities
This is a 31 page Smartboard file teaching students how to write inequalities. The lesson begins with a review of the inequality symbols and what they mean. The lesson progresses into how to look at a graph and write an inequality that matches it. There are plenty of practice pages that include answers.
Grades:
7th - 10th
Types:

SmartBoard Lesson on Graphing Linear Inequalities
This is an Algebra lesson for the SmartBoard on graphing linear inequalities and systems of linear inequalities. This Notebook file starts with reviewing the inequality symbols and how to graph an inequality on the number line. It then moves on to the definition of a linear inequality and how to graph one on the coordinate plane. The steps to follow are clearly identified and several example problems are provided. The second half of this lesson gives problems about solving systems of linear ineq
Subjects:
Grades:
8th - 12th, Higher Education, Adult Education
COORDINATE GRAPH INTERACTIVE ALL QUADRANTS HOTSPOT GAME FOR 6TH , 7TH & 8TH
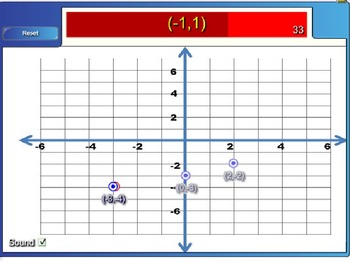
THERE ARE 9 SLIDES. I GAVE YOU 5 GAMES TO START WITH AND INSTRUCTIONS ON HOW TO MAKE MORE. THIS INTERACTIVE COORDINTATE GRAPH ACTIVITY USES ALL QUADRANTS WITH INTEGERS TO CHECK FOR UNDERSTANDING OR INTRODUCE THE CONCEPT OF GRAPHING ON A COORDINATE PLANE IN ALL QUADRANTS USING INTEGERS. YOUR STUDENTS WILL HAVE TO USE THE UNDERSTANDING OF THE POSITIVE AND NEGATIVE NUMBERLINE. GREAT FOR AN INTRODUCTION, LESSON OF THE DAY OR REVIEWING. CAN BE REVISITED MANY TIMES - KIDS LOVE IT!
Subjects:
Grades:
6th - 8th
Multiplying and Dividing Inequalities Smartboard Slides Lesson
Math Teachers ~ You'll LOVE this GREAT Multiply-and-Divide Inequalities-Smartboard-Slides-Lesson that reviews how to graph Inequalities and teaches how to solve multiplication-and-division-of-Inequalities. Your students will LOVE this lesson! You'll enjoy using it year after year! WARNING: You MUST have SMART Technologies SMART software, and a SMARTBOARD to teach from, to effectively download, open and use this Interactive Smartboard Lesson. Go to https://legacy.smarttech.com/en/products/educati
Subjects:
Grades:
5th - 8th, Staff
One Step Equations and Inequalities Review Quiz Smartboard Slides Lesson
Math Teachers ~ In this smartboard lesson, you are getting 32 slides, fabulous re-teaching, review, practice for Solving-1-Step Equations-and-Inequalities. LOTS of practice problems, as well as re-teaching and re-explaining. QUIZ is also provided on last two slides. Everything you need for a Smartboard-slides-lesson to review, reteach and practice Solving Equations and Inequalities! You'll LOVE this resource and use it year after year! WARNING: You MUST have SMART Technologies SMART software, an
Subjects:
Grades:
5th - 8th, Staff
How I Teach the Coordinate Plane
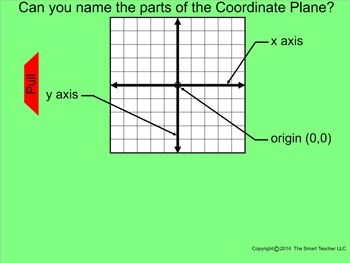
This is a 36 page Smartboard file over the Coordinate Plane. This lesson starts by explaining the parts of the coordinate plane. This would include the two axis lines and the origin. The lesson names the quadrants and shows the sign of ordered pairs in each quadrant. There is lots of practice plotting points and naming quadrants. All practice pages include answers.
Subjects:
Grades:
5th - 8th
Types:
Showing 1-24 of 134 results


