17 results
Middle school statistics resources for parents
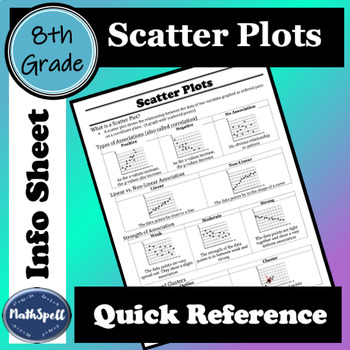
Scatter Plots and Correlation/Association | 8th Grade Math Quick Reference Sheet
This 8th Grade Math Quick Reference Sheet defines what a scatter plot is. Two sheets are provided to give you the option to use the term correlation or the term association. It shows examples for positive, negative, and no association/correlation and explains what each type means. Examples are given for linear and non-linear association/correlation, different strengths (weak, moderate, and strong) as well as what outliers and clusters are.This info sheet can be used for students to review scatte
Subjects:
Grades:
8th - 9th
Types:
CCSS:
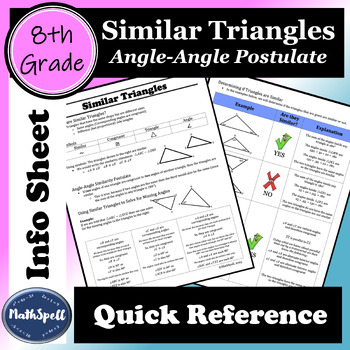
Similar Triangles | Angle-Angle Postulate | 8th Grade Math Quick Reference Sheet
This 8th Grade Math Quick Reference Sheet Defines what similar triangles areShows symbols for similar, congruent, triangle, and angleUses symbols to write similarity statementsExplains the angle-angle similarity postulate Describes how to use similar triangles to solve for missing angles in a triangleShows examples for determining if triangles are similar (includes an example that uses parallel lines cut by a transversal)The second page is available in color as well as black and white.This info
Subjects:
Grades:
8th - 9th
Types:
CCSS:
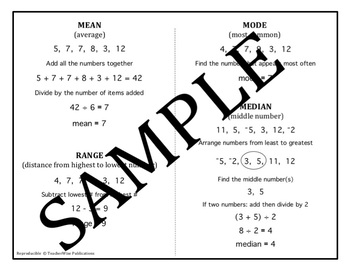
Mean, Median, Mode, Range Quick Notes
Ready Made Notes: 1 two-sided page • Ready-made, homework support • Originally designed for use with remedial students • Meets the accommodation needs of special education and 504 students Math teacher seem to have an innate ability to see mathematical relationships and patterns. This Is not the case for the majority of the population and certainly not for struggling learners. Slow learners and learning-disabled students often need to see, hear, and understand the concepts and related skills t
Subjects:
Grades:
5th - 8th
Types:
Data from Home Math Project - Distance Learning About Social Distancing
***ALL PROCEEDS THAT I RECEIVE FROM THIS PROJECT WILL BE DONATED TO CHARITIES SUPPORTING STUDENTS AND FAMILIES IN NEED DURING THE COVID-19 CRISIS!***In this unprecedented time, mathematics and distance learning has the potential to provide understanding, humanity, and community as we all work to understand our experiences. In this project, students choose something about their experience while home from school to track over a period of 15 days. Students share their data in a class google sheet,
Subjects:
Grades:
6th - 12th
CCSS:
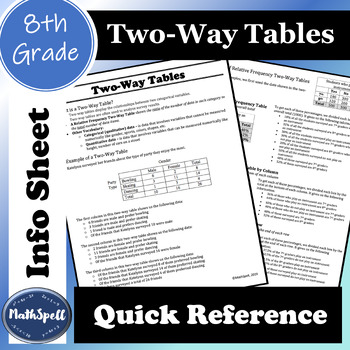
Two-way Tables | Relative Frequency Tables | 8th Grade Math Quick Reference
This quick reference info sheet explains Two-way Tables and Two-way Relative Frequency Tables (including Total Relative Frequency, Total Relative Frequency by Column, and Total Relative Frequency by Row). There are explanations and examples for each type of table. This can be used for students to review the concept after they've already learned it or as an already complete notes page to help teach the concept. It is also a great resource to give to parents at the beginning of the unit as a way f
Subjects:
Grades:
8th
Types:
CCSS:
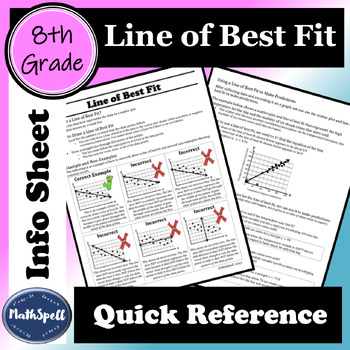
Line of Best Fit | 8th Grade Math Quick Reference Sheet | Cheat Sheet
This 8th Grade Math Quick Reference Sheet defines what a line of best fit is, explains how to draw a line of best fit, includes examples and non-examples to show common mistakes, and shows step-by-step examples of how to use a line of best fit to make predictions. The first page is available in color as well as black and white.This info sheet can be used for students to review Line of Best Fit after they've already learned about the concept or as an already complete notes page to help teach the
Subjects:
Grades:
8th - 9th
Types:
CCSS:
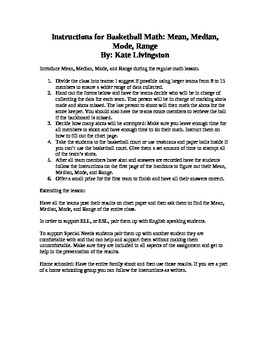
Basketball Math: Mean, Median, Mode, Range
Make math fun with this installment of Basketball Math: Mean, Median, Mode, and Range. Use a fun game to collect Data, use that data on the enclosed forms to reinforce the meanings of Mean, Median, Mode, and Range.
Subjects:
Grades:
4th - 6th
Types:
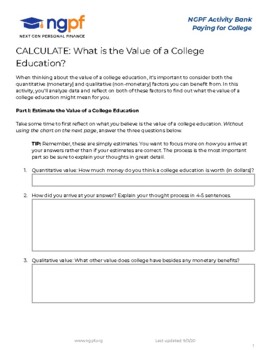
CALCULATE: What is The Value of A College Education?
Using research from the US Bureau of Labor Statistics, students will calculate the value of a college education. First, they will estimate its value. Then, they use a chart from the Dept. of Labor to calculate the value (in career earnings) of different levels of education. Finally they will reflect on that value. NGPF Activities teach your students key personal finance concepts while also honing their analytical skills.
Grades:
7th - 12th, Higher Education, Adult Education
Types:

MedAware Labels and Chart Kit Booklet
Always Know When, What, Why and How Medications are taken.
(Avoid under and overdosing prescription, generic and other drugs).
Subjects:
Grades:
PreK - 12th, Higher Education, Adult Education, Staff
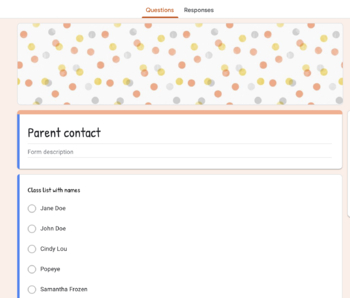
Parent contact record
This can be used to track when parents have been contacted. This includes student names, parent name conacted, reason, discussion, and their response. This way you have proof of contact and that you addressed an issue. Can be used for conferences as well.
Grades:
K - 7th
Types:
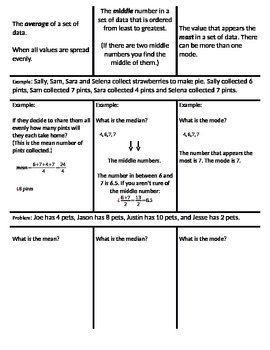
Measures of Central Tendency Foldable
Review or teach mean, median and mode using this foldable for student notebooks.
The two pages should be copied back to back. Then students should cut along the dotted lines and fold flaps up to create the foldable. It can then be glued or taped into notebooks and completed.
Subjects:
Grades:
5th - 7th
CCSS:
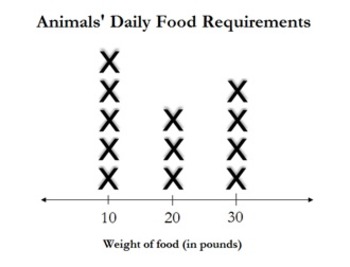
Statistical Analysis Learning Activity (with Answers)
This statistical analysis learning activity is designed by Jackson Education Support to offer students a fun, engaging learning experience. With this product, parents and teachers spend minimal time preparing to implement quality math activities that intertwine percentages and averages with a zoo-inspired storyline. PDF file includes math activity with line plot and detailed answer key.Click here to visit the blog and join the conversation...
Subjects:
Grades:
6th - 12th, Higher Education, Adult Education
Types:
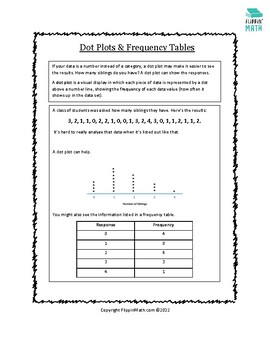
Dot Plots (M4P.E34)
Dot plots and frequency tables can be used to show responses to survey questions. This one-page notes worksheet explores these two data representations in a concise way. It is a part of a series of resources created to accompany the book, Math for Parents: Elementary Edition. Find more resources here on TPT, or on my website @ flippinmath.com.
Subjects:
Grades:
1st - 6th
Types:
CCSS:
Also included in: Math for Parents: Elementary Edition

Best Fit Line "Teaching and interpreting line of best fit "
- 32 Activity slides to practice and learn plotting, drawing and identifying line of best fit - Word problems to interpret the line of best fit to predict outcomes
Subjects:
Grades:
8th - 9th
Types:
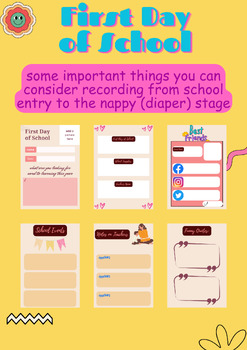
First Day of School
Remember that the key is to document things that feel significant to you and your child. These records will become cherished memories that you can look back on with fondness as your child grows up
Subjects:
Grades:
PreK - 9th

Course Syllabus Template
This product is a Course Syllabus Template for you to edit and make your own. This template includes all important information students, parents/guardians, and administration need to know. In an organized manner, it covers the following areas:Course TitleTeacher Information (name, email, room number)General Course Information & ExpectationsCourse MaterialsTextbookCourse Topics/ScheduleExam ScheduleGrading PolicyGoogle Classroom/Remote Learning PolicyHomework PolicyTest/Quiz PolicyOffice Hour
Subjects:
Grades:
7th - 12th, Higher Education, Adult Education

Website Links (Mean, Median, Mode, Range) Tutorial Videos
This product contains 4 website links to Free Tutorial videos for you to show as a whole class or share with a small group of struggling students. Sometimes, seeing a lesson one more time really helps our visual learners. You could also send the links to parents by email and encourage them to watch them with their child so they may help their child with homework, studying, etc.This file includes 4 website links: Tutorial Video 1 Mean, Mode, Median Tutorial Video 2 Mean, Mode, Median Creatin
Subjects:
Grades:
5th - 7th
Types:
Showing 1-17 of 17 results


