6 results
Middle school statistics resources for staff and administrators
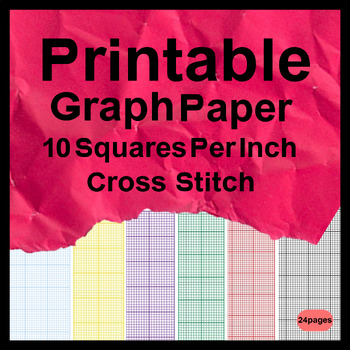
Printable Graph Paper 10 Squares Per Inch Cross Stitch
Printable Graph Paper 10 Squares Per Inch Cross Stitch - Grid paper is essentially the type of paper most commonly used for drawing and sketching purposes. It is widely used for making plan charts, designing websites, developing home ideas and so forth. A great deal of businesses who need to produce a company card, business brochures, catalogues, brochures, and so forth need this kind of graph paper.
Subjects:
Grades:
5th - 12th
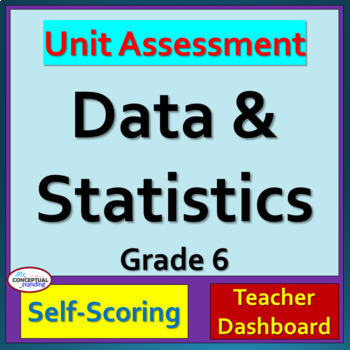
6th Grade Math CCSS Statistics & Data Displays Test Prep Review Assessment
This 6th Grade Math digital, auto-grading, no prep, formative assessment and test prep review is on Data Displays, Data Analysis and Statistics (and Probability). It is a check for understanding on the 6th Grade Common Core Standards: statistical questions, describing data distributions using center, spread (range) and overall shape, working with line plots, dot plots, histograms, box and whisker plots, finding the mean, median, measuring variability using IQR interquartile range and/or MAD mean
Subjects:
Grades:
6th
Progressive Framework AusVELS Mathematics AC – Statistics & Probability (F-7)
AusVELS - Progressive Framework - Mathematics AC - Statistics & Probability - Strands and Sub-strands with Elaborations (F-7)
Learn about the myriad of ways these documents can be used by visiting http://effectivecurriculumideas.weebly.com/tutorials-using-the-progressive-curriculum-frameworks.html
Subjects:
Grades:
K - 7th
Australian Curriculum - Progression - Maths (v7.2) Stats & Probability (F-7)
Australian Curriculum - Progressive Framework - Mathematics (v7.2) - Statistics & Probability - Strands and Sub-strands with Elaborations (F-7)
Subjects:
Grades:
PreK - 7th
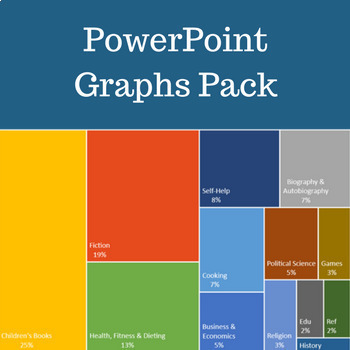
PowerPoint Graphs for Data Visualization and Presentation
This free version includes 9 fully editable PowerPoint graphs.
★ Download 100+ PowerPoint Graph Templates for Data visualization and Presentation (with FREE UPDATES) ★
Get all stunning data chart templates here - 100+ PowerPoint Graph Templates for Data visualization and Presentation (with FREE UPDATES)
Subjects:
Grades:
5th - 12th, Higher Education, Adult Education, Staff
Progressive Capacity Matrix - AusVELS Mathematics AC - Chance Events
Progressive Capacity Matrix - Chance Events - Year Level Labels Hidden
Visit http://effectivecurriculumideas.weebly.com/the-progressive-curriculum-frameworks-for-ausvels-ac-victoria.html#QLAProgressive for more details.
Subjects:
Grades:
K - 7th
Showing 1-6 of 6 results


