6 results
Statistics resources for Montessori

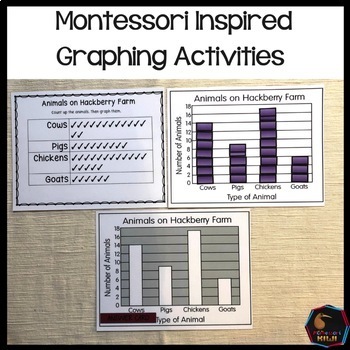
Self Correcting independent Graphing activities
Ideal for Montessori classes these graphing activities help students learn to graph data and to interpret graphs. Designed in a Montessori style these activities allow students to work independently as many times as needed to learn these skills! Included are 6 x sets of data for graphing5 x graphs for interpretingAnswer cards/self correction included!sized for US letter - if you change the sizing the graph pieces may not fit!Click here for all of my Montessori 6-12 ResourcesYou can get this prod
Subjects:
Grades:
2nd - 5th
Types:
Also included in: Montessori Store Bundle

Walker Learning: Reporter Templates for Investigations WITH ASSESSMENT (WA)
Walker Learning Approach: Reporter Templates for Investigations WITH ASSESSMENT (WA Curriculum Aligned)Whether you're an expert at implementing the Walker Learning Approach or are brand new to it this year, these beautiful templates will be useful for your students in the Reporter role. The 4 different templates allow students to engage in different forms of data collection, including tallies, bar graphs, Venn diagrams, and free choice. I usually use the more structured templates at the beginnin
Subjects:
Grades:
PreK - 2nd
Types:

Upper Elementary Fractions F/G Packet
Students will learn to rename fractions in order to add or subtract fractions with mixed numbers. They will have an opportunity to experience probability and statistics and percentages. These packets work best as a full set. Word problems and the answer key are included.PRINTING INSTRUCTIONS:choose color copiesOnly print double sided for cards that have an a and bflip on short edgespecify the scale *If you find any errors, please email at admin@willow-montessori.com. We will send you an updated
Subjects:
Grades:
3rd - 6th
Also included in: Upper Elementary Fractions Bundle - Packets A-H

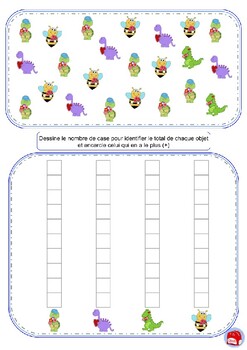
VALENTINE`S DAY / Statistics (+ / = / -)
(observation / notion of statistics (+ = -) / addition / recognition of figures from 1-10) The child must count each of the objects identified at the bottom of each of the columns of boxes and total them by filling in the appropriate boxes. Then the child must determine by circling the object on page 1 - The one with the most, page 2 - Whoever has equal,
Subjects:
Grades:
PreK - 1st
Types:

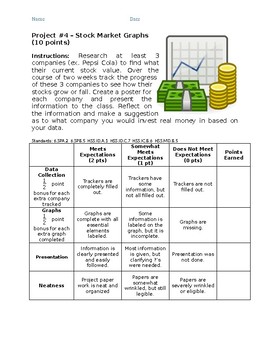
Stock Market Graphs
Students use their skills to track and interpret trends with at least 3 current companies. They collect data on stock price for two weeks, graph the information, then make predictions about what they think will happen based on the trends. Great for use in finance and investment classes, math, or science to collect and analyze data. I used this in my middle school RTI classes for project-based learning. Let me know what you think or how I might make it better. Thank you!
Subjects:
Grades:
6th - 12th
Types:
Also included in: Math Projects Bundle

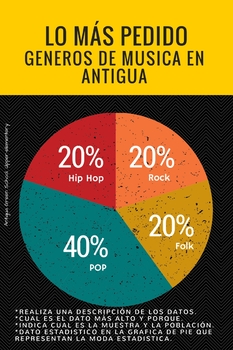
Montessori Material Upper-Elementary, Statistical Activity
Statistical activity. English-Espanish
Subjects:
Grades:
4th - 10th
Types:
Showing 1-6 of 6 results


