51 results
5th grade graphing rubrics
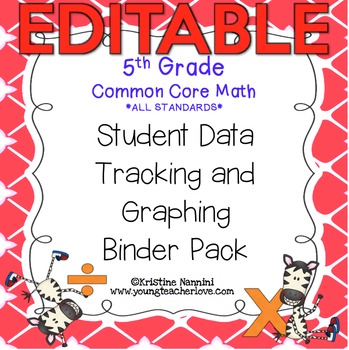
Student Data Tracking Binder - 5th Grade Math - Editable
These Student Data Tracking Binders are an easy-to-implement system. Put students in charge of tracking their own learning and data! With this Student Data Tracking Binder, your students will monitor their own growth and progress using standards based assessments (also found in my store), rate and date their learning using Marzano's Levels of Thinking/Understanding, and keep track of "I can" statements or learning targets as they progress through the Common Core Standards. This resource is now e
Subjects:
Grades:
5th
Types:
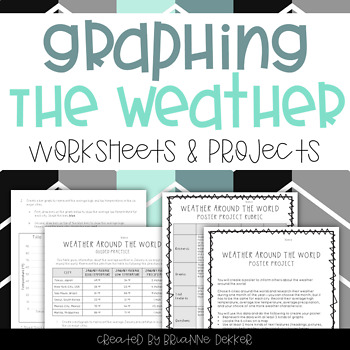
Graphing the Weather - Worksheets and Projects
This product contains science and math graphing worksheets and projects for a unit on weather. These resources were created with NGSS content and evidence statements in mind.
The first set of worksheets focus on weather around the world, and the second set focus on weather patterns in one area. Each set contains guided practice, in which students are given data and asked to create different types of graphs to represent the data; independent practice, in which students must gather data and then
Subjects:
Grades:
3rd - 5th
Types:
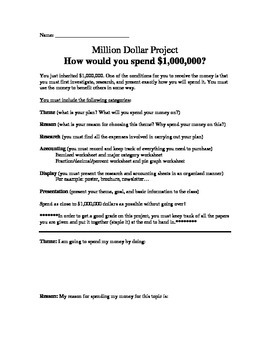
Million Dollar Project (Graphing, decimals, fractions, accounting and percents)
What would you do with a million dollars? How would you spend it?
In this project you've been left a 1 million dollar inheritance. The catch is you must first research and present how you will spend the money.
In the first part of the experiment, the students will fill out an accounting chart, where they will fill out an itemized chart displaying each item they plan on purchasing to complete their million dollar project. They will than be asked to put all those items into major categorie
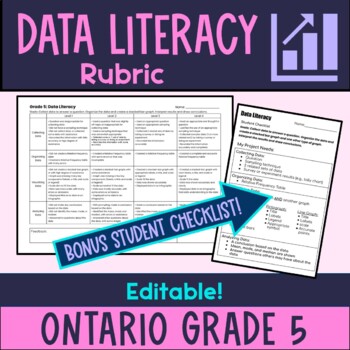
Grade 5 Data Literacy: Graphing Rubric - Ontario
This is a rubric and student checklist for a Grade 5 graphing unit project, based on the 2020 Ontario Math Curriculum for Data Literacy. Save time with this ready-made rubric to make your grading easier. It's also editable in Google Docs, so you can change it to suit your needs and focus. Includes expectations for:collecting dataorganizing data visualizing dataanalyzing data.This rubric will save you time as you grade your students learning throughout your data literacy unit on graphing. Student
Grades:
5th
Types:
Collecting, Organizing and Interpreting Data Assignment -Data Management Digital
In this culminating task, students will create a survey question, organize their data using frequency tables, graph their data and interpret their results. They will also find the mean, median, mode and range of the data.This is assignment asks students to create a presentation that will include the following:A survey questionMean, Median, Mode and Range of the dataFrequency table for the data3 different visual representations of their findingsInterpretation of the resultsThis product includes
Grades:
4th - 8th
Types:
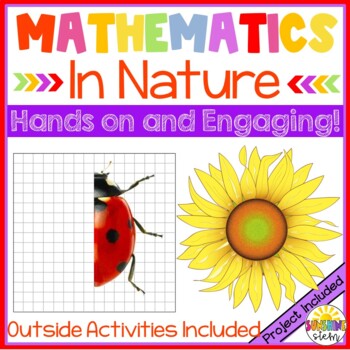
Mathematics in Nature {CCSS Math and NGSS Aligned}
Students explore and apply the principles of mathematical patterns in nature in a fun and engaging way! First, students identify and describe patterns in the natural world before heading outside to find patterns on their own. Next, students begin to explore number patterns in nature using the Fibonacci sequence. Fin fingerprint activity keeps students interested and engaged! Next, explore cycles in nature by creating a model on paper using 3-dimensional objects. Rubric included. Students are
Grades:
4th - 7th
Types:
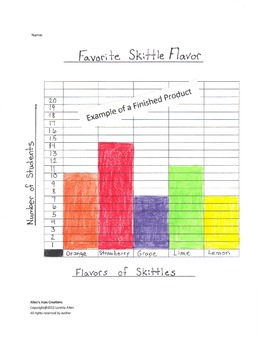
Bar Graphing - Skittles Candy
Students will taste test each Skittles Candy flavor, and then ask their classmates their favorite flavors and record the data collected. Then they use their data to create a bar graph. I use this in my 3rd grade class and it is always a big hit activity!
Subjects:
Grades:
2nd - 6th
Types:
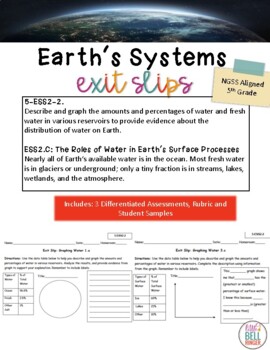
NGGS Earth's Systems Exit Slips
NGSS Earth's Systems Exit Slips--Save tons of time by downloading my crafted assessments, which integrate math and writing standards into your curriculum. As you cover topics such as the hydrosphere and water cycle, choose one of my differentiated exit slips to assess your diverse learners. **Rubric Included About NGSS: Next Generation Science Standards, developed by 26 state partnerships in 2013, have already been adopted by 12 states (including Illinois, California, Delaware, New Jersey, etc)
Grades:
5th
Types:
NGSS:
5-ESS2-2
Introduction to Sharks, Skates and Rays
Biology, Marine Biology, Upper Level Elementary ScienceIncluded in the package:- Introduction to Sharks Powerpoint (41 slides)- Shark Anatomy Powerpoint (46 slides)- Cartilaginous Fish (Rays & Skates) (44 slides)- Shark Game Show (Jeopardy style) Review PowerpointTo assess:- Shark Test- Shark Test Study Guide- Shark Test Study Guide ANSWERS- Cartilaginous Fish Quiz - Cartilaginous Fish Quiz ANSWERSStudents Research and Activities:- Shark Species Internet Research Questions- Shark Species Pre
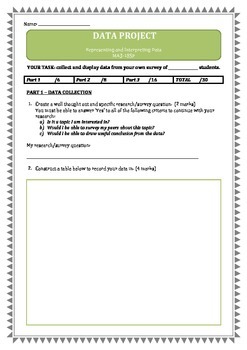
DATA & GRAPHING ASSESSMENT (Australian National Curriculum)
This assessment is designed to meet the Australian National Curriculum outcome MA3-‐18SP (Representing & Interpreting Data).
Students need to have prior knowledge of creating survey questions, conducting a survey, recording data and how to display data in a variety of graphs. I allow my students three days to complete the assessment, one day per section to ensure and encourage high quality work.
Students are required to do the following to complete this assessment:
Part 1 (collect data)
Subjects:
Grades:
5th - 6th
Types:
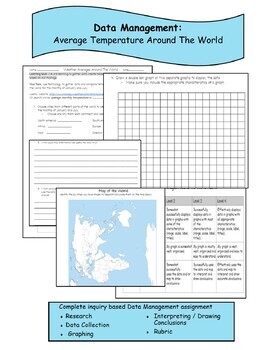
Data Management Assessment-Average Temp Around The World -Distance Learning
This comprehensive Data Management assessment incorporates real life application and authentic learning. This activity can be used as a formative assessment during a unit, after a unit or part of your math centers. It incorporates inquiry and research to engage and stimulate learning.It includes:ResearchData CollectionGraphingInterpreting, Analyzing and Drawing ConclusionsRubric
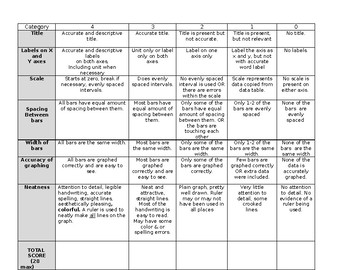
Bar Graph Rubric
Rubric to easily grade bar graphs made by students. Has a 4 point scale for each of these categories: Title, Labels, Scale, Spacing between bars, Width of bars, Accuracy of graphing, Neatness. Top total score on the rubric is 28 points.
I print 2 rubrics on one page and have a smaller version to staple to the students work.
I always include the word version for easy editing! We all teach a little differently!
Grades:
5th - 8th
Types:
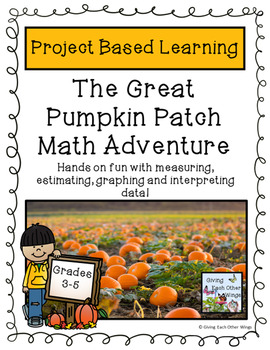
The Great Pumpkin Patch Math Adventure
Wow! Lots of fun combined with lots of math, reading, and science. A perfect recipe for learning! This is one of my favorite fall Project Based Learning math activities to do with my class. The students are so busy having fun, they don't realize how much math they are learning! Students work cooperatively to make estimates about the height, weight, circumference, no. of seeds, and cost of their pumpkin at the Estimation Station. Then they will have fun finding the actual data on their pumpkins.
Subjects:
Grades:
3rd - 5th
Types:
Skittles Graphing Project
This project is all about graphing! Using skittles, students will graph a frequency table, bar graph, circle graph, stem and leaf plot, and find the mean, median, mode, and range of a set of data. They will also have to survey classmates to gather data!

PBL Math project Education vs. Wages
The information provided is a guide to giving your students some freedom and choice in a project based on seeing the value of education in their future.
Subjects:
Grades:
4th - 9th
Types:
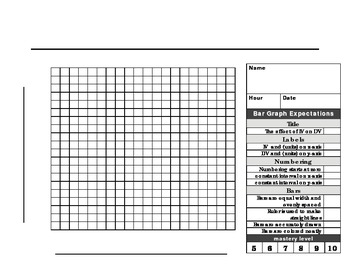
Bar Graph paper and rubric
This 20 X 20 graph paper with rubric is made for a beginner scientist to make a the perfect BAR graph. The checklist format makes it easy for students to know what is expected when graphing. Enjoy!
Subjects:
Grades:
1st - 12th, Higher Education, Adult Education
Types:
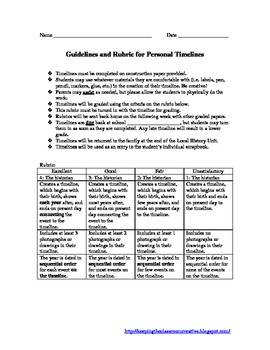
Student Timeline
This is a guide for student creation of a personal timeline. It is connected to Ohio standards in History under Historical Thinking. Timelines are to be completed on construction paper provided by the teacher.
Students may use whatever materials they are comfortable with (i.e. labels, pen, pencil, markers, glue, etc.) in the creation of their timeline. Let them be creative!
Parents may assist as needed, but please allow the students to physically do the work.
Timelines are then graded using the
Grades:
2nd - 6th
Types:
Valentines Day Coordinate Plane Project-All four quadrants
This is an open ended kind of project to allow students to be creative on the coordinate plane. An example is attached that you can show your students. A rubric is attached to the document so that you can grade this if you choose, and your students know what to expect about how this will be graded. I use this project every year for my 6th grade students, and they love the choice of creativity that this project offers. Students can complete this on blank graph paper. I always require the followin
Subjects:
Grades:
5th - 8th
Types:
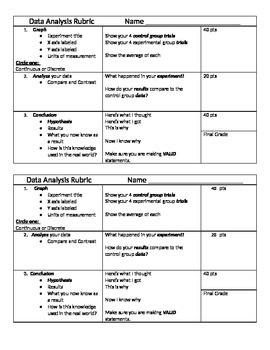
Rubric for Graph and Data Analysis
Use after students have collected data and information from a hands on experiment/lab. The students create a graph from their data collection table and write their results and reflection under it. This is a good companion piece to my Student Experiment/Lab Form. The upload includes two mini rubrics to attach to the student's work.
Subjects:
Grades:
5th - 8th
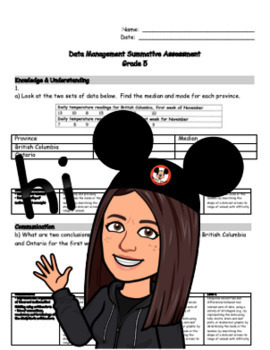
Grade 5 - Math: Data Management/Graphing (Modified) Summative Assessment/Test
You will receive a digital copy of a modified version of a Grade 5 Ontario Science Assessment/Test for your ELL/IEP students. This copy also includes rubrics with Ontario curriculum expectations that will allow you to obtain an easy assessment mark/grade for your students to receive on their report card. The work is all done for you!This item is created by an Ontario Certified teacher who has 15 years of experience.Thank you for purchasing!
Grades:
5th
Types:
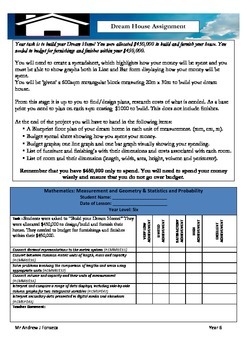
21st Century Math Project - Measurement + Geometry & Statistics + Probability
21st Century Math Project
Measurement + Geometry & Statistics + Probability
Exciting and engaging project based learning.
Package includes:
- Task outline
- Student check list rubric
- Teacher Rubric based on Australian Curriculum & Judging standards
Subjects:
Grades:
5th - 7th
Types:
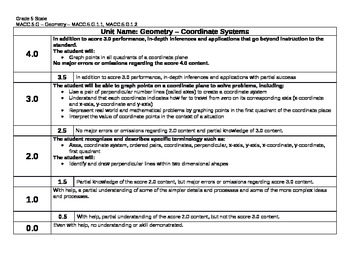
Scale Math Common Core 5th Grade Geometry 5.G.A.1, 5.G.A.2 CCSS 5GA1, 5GA2 Gr 5
This is a scale for the Common Core standards MACC.5.G.A.1 and MACC.5.G.A.2 (In FL: MACC.5.G.1.1 and MACC.5.G.1.2) for 5th grade Geometry. It's a 0-4 scale, with 3 being the proficient level of mastering the standard. Please check out my numerous other scales as well.
Grades:
5th
Endangered Species Project
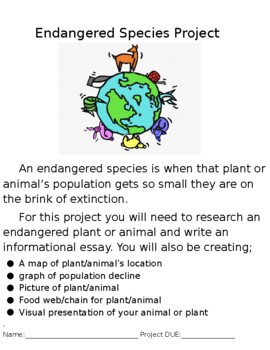
This project encompasses writing about endangered animals. It conforms to NGSS standards as well as Common Core standards for ELA and Math (California). It contains a rubric, graphic organizer, and examples for students. This project can be edited to fit your classroom needs.
Grade 5 - Math: Data Management/Graphing Assessment/Key Question
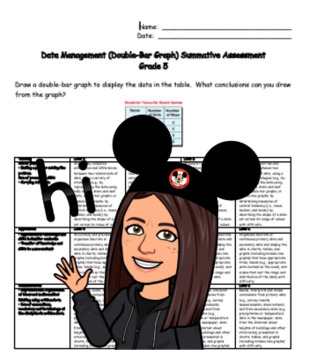
You will receive a digital copy of a Grade 5 Ontario Math Assessment/Key Question. This copy also includes rubrics with Ontario curriculum expectations that will allow you to obtain an easy assessment mark/grade for your students to receive on their report card. The work is all done for you!This item is created by an Ontario Certified teacher who has 15 years of experience.Thank you for purchasing!
Grades:
5th
Types:
Showing 1-24 of 51 results


