362 results
Adult education statistics activities
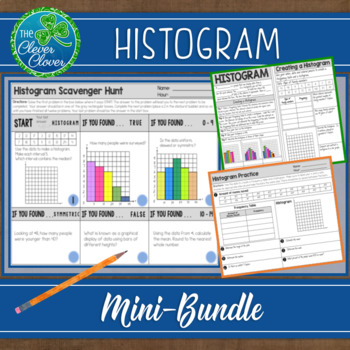
Histogram - Notes, Practice Worksheets and Scavenger Hunt
This histogram resource includes guided notes, a practice worksheet and a scavenger hunt. Your students will have the opportunity to create, interpret and discuss histograms. Below, you will find a detailed description of the notes, worksheet and scavenger hunt. Guided NotesThere are two small pages of guided notes. The first page provides the definition of a histogram and step by step instructions on how to create a histogram. The bottom portion of the notes has students examine three types (un
Subjects:
Grades:
6th - 9th, Adult Education
CCSS:
Also included in: Statistics Bundle - Guided Notes, Worksheets & Scavenger Hunts!
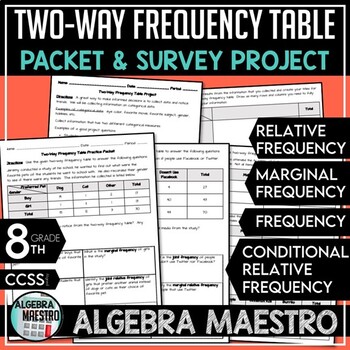
Two-Way Frequency Table Practice Packet & Project
With the Two-Way Frequency Table (or two way tables) Practice Packet & Project you'll receive:-3 pages of student practice via packet-3 pages of the answer key for the packet-2 pages for the student driven projectThe Two-Way Frequency Table Packet and Project are meant to be a review and reinforcement activity. Students can practice and further enhance their understanding using the Packet Practice. Teacher may want to further differentiate the content for advanced students and give them th
Subjects:
Grades:
7th - 12th, Higher Education, Adult Education
Types:
CCSS:
Interpreting Graphs for the Middle & Junior High School: Book 2
Here is another set of data graphics for your students to analyze and interpret. Using survey results from the USA Today newspaper, students will be asked to explain what the graphics are illustrating. Each activity will ask the student to identify basic information presented in each graphic and make some projections based on the data given in the survey.
The activities in this packet are a great way to improve your student’s skills in taking apart graphic displays of information. Brin
Subjects:
Grades:
4th - 10th, Adult Education
Types:
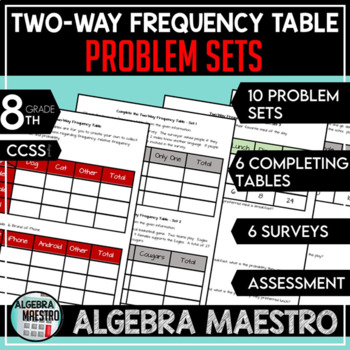
Two-Way Frequency Table Problem Sets
The Two-Way Frequency Table (or two way tables) is designed to give students a lot of practice so they can fully understand and master two-way frequency tables. Included: 10 problem sets (40 total problems), 6 completing tables problem, 6 surveys to collect & analyze data, an assessment, and answer keys to every activity. These are great activities to get students to understand statistics and relationships including ratios, fractions, probability, and develop critical thinking and reasoni
Subjects:
Grades:
6th - 12th, Higher Education, Adult Education, Staff
Types:
CCSS:
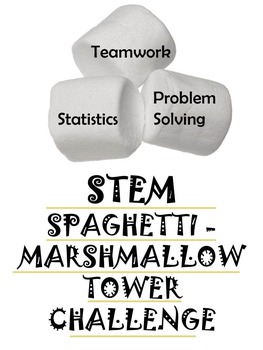
BACK TO SCHOOL STEM ACTIVITY: Spaghetti Marshmallow Challenge
Don't miss out on this wonderful opportunity for your students to work collaboratively, problem-solve, show creativity and use their math skills! This Spaghetti Marshmallow Challenge cost me less than $2.00 for all supplies but delivers such a big bang for the buck! Fun for students K-12 (they say that the kindergarteners actually build the highest!). Enjoy!
Subjects:
Grades:
PreK - 12th, Higher Education, Adult Education, Staff
Types:
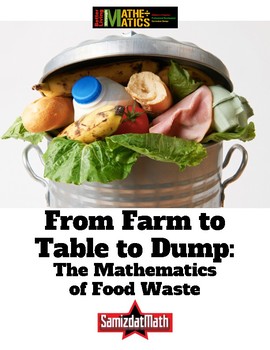
Food Waste and Mathematics: From Farm to Table to Dump
Here's a very uncomfortable fact: it takes 4 pounds of potatoes to make 1 pound of potato chips. That means that for every 1 pound bag of potato chips you eat, 3 pounds of potatoes have to be thrown away. What a waste of food! This is a series of activities that looks at the hidden world of food waste. It includes a look at how much food is wasted as it is "processed" into finished products like french fries and potato chips. It also includes mathematical activities where students calculate how
Subjects:
Grades:
5th - 12th, Adult Education
Types:
Maze - Find Mean, Median, Mode, & Range
This maze is part of : Maze - BUNDLE Statistical Measures (Mean, Median, Mode, & Range)This activity is a good review of understanding how to "Find the Mean, Median, Mode, & Range" . Based on the path, the student will be asked to calculate one of these statistical measures at each move. This maze is "ALL IN ONE"!!!A set of data is provided and students would need to be familiar of how to find the MEAN, MEDIAN, MODE, & RANGE of the data points.There are 15 data sets provided in ea
Subjects:
Grades:
4th - 12th, Higher Education, Adult Education
Types:
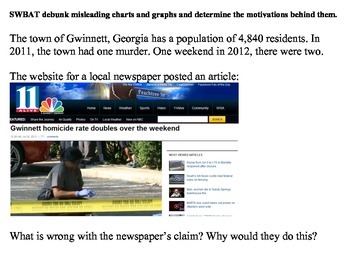
Misleading Charts and Graphs (Statistics)
Teaching students to deduce information provided in charts and graphs is an essential part of any math curriculum.
However, what do you do when the graph itself provides misleading or false information?
This lesson is a good way to get students to look critically at graphically displayed data and see through those who try to manipulate data for their own purposes.
Subjects:
Grades:
7th - 12th, Higher Education, Adult Education
Types:
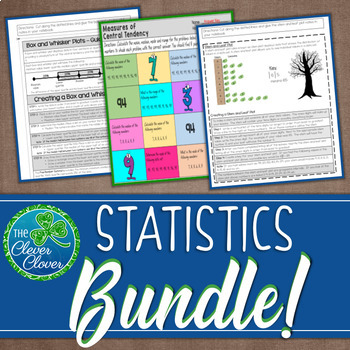
Statistics Bundle - Guided Notes, Worksheets & Scavenger Hunts!
Are your kids studying the measures of central tendency, box and whisker plots, stem and leaf plots, two-way tables, histograms and scatter plots? This valuable resource includes guided notes, worksheets, scavenger hunts, assessments and more that you can use for your statistics unit. Below you will find a brief description and link of each resource.
Measures of Central Tendency - Guided Notes, Worksheets and Scavenger Hunts
This resource includes guided notes, practice worksheets and two scave
Subjects:
Grades:
6th - 9th, Adult Education
CCSS:
Crash Course Statistics COMPLETE SERIES BUNDLE ~ Distance Learning
Distance Learning - #DistanceLearningEpisode Guides for Crash Course Statistics YouTube Series!Each guide comes with two versions (with and without timestamps), and a complete answer key.This product easy to use, no-prep product is a perfect last minute lesson plan, review activity, extra "filler" to keep on hand, substitute lesson plan, or homework assignment.*Great AP test prep!Plus it's only $0.70 per episode!-Answer key included for every episode guide-Questions are a variety of formats and
Subjects:
Grades:
9th - 12th, Higher Education, Adult Education
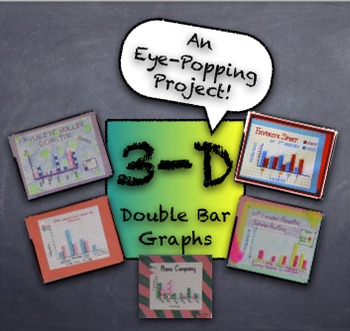
3-D Double Bar Graphs PROJECT from Student Generated Survey Data - Fun Project
This project creates quite an impressive product with simple supplies easily accessible in any classroom. Students generate data from surveys given to peers, using simple questions like, "What's your favorite pizza topping?" Students use survey results to create a 3-dimensional "girls versus boys" double-bar graph. Using centimeter graph paper, markers, and glue sticks, the double-bar graph projects are truly eye-popping! Project description, survey information, and graph assembly instructio
Subjects:
Grades:
3rd - 12th, Adult Education
Types:
Summer School, Camp Activities, PBL | High School Math (AP Statistics)
Spark Student Interest in Real-World Statistics with Scienovate's AP Statistics Project-Based Learning Bundle!Are you an educator, homeschool parent, or high school student looking for engaging ways to apply AP Statistics concepts to real-world challenges? Look no further than Scienovate's Project-Based Learning Projects Bundle for AP Statistics!This comprehensive bundle goes beyond traditional theoretical projects, offering a unique set of Project-Based Learning (PBL) activities specifically de
Subjects:
Grades:
9th - 12th, Higher Education, Adult Education
AP Psych / AP Psychology - Unit 1: Scientific Foundations - Activity Pack!
Includes the wildly popular ESCAPE ROOM Activity, as well as analyzes and practices nearly all standards regarding Unit 1: Scientific Foundations of Psychology, including 1.B, 1.C, 1.E, 1.F, 1.G, 1.H, 1.I, 1.J, 1.L, 1.M, 1.N, and 1.O!In class or as homework, students must assess, analyze, graph, calculate, and interpret data regarding psychological studies. All questions are original, and modeled after the College Board format and difficulty. After learning about the topics in class, these are
Subjects:
Grades:
8th - 12th, Higher Education, Adult Education, Staff
Types:
Summer School, Camp Activities, PBL | High School Math (Statistics)
Spark Curiosity and Ignite Future Scientists with Award-Winning Project-Based Learning (PBL) in Statistics!Are you an educator, homeschool parent, or student looking for engaging, real-world PBL experiences that go beyond the typical "science fair volcano"? Look no further than the Scienovate Science Fair Projects Bundle for High School!This comprehensive bundle throws away the tired, superficial activities and dives headfirst into the powerful application of Statistics in solving critical chall
Subjects:
Grades:
9th - 12th, Higher Education, Adult Education
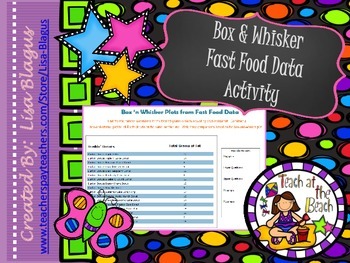
Box 'n Whisker Data for Local Fast Food Restaurants
This activity brings a real-life activity into the classroom. Students look at 4 popular fast food restaurants (Arbys, KFC, Dunkin Donuts, and Pizza Hut)and find the median, maximum, minimun, lower quartile, and upper quartile from their grams of fat. After looking at each of them, students are asked to answer questions pertaining to the box and whisker graphs they've drawn from the data. A fun way to construct graphs and look at data!!!
Looking for a few more resources? This product is par
Subjects:
Grades:
6th - 11th, Adult Education
Types:
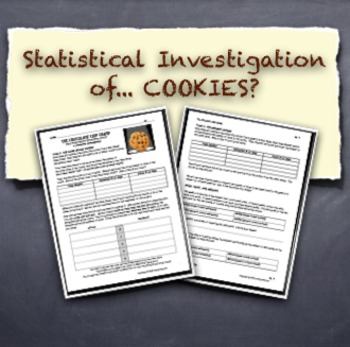
Statistical Investigation Graphing and Analyzing COOKIE Data!
Does name brand mean more chocolate chips? That is the question that fuels this entire statistical investigation! Students gather chip data from actual cookies, analyzing and graphing it along the way. By the end of the investigation, students will have explored mean, median, mode, range, back-to-back stem-and-leaf plots, double bar graphs, box-and-whisker plots, and the idea of estimating. All cookies involved will be destroyed... but it's all worth it!
Subjects:
Grades:
4th - 9th, Adult Education
Types:
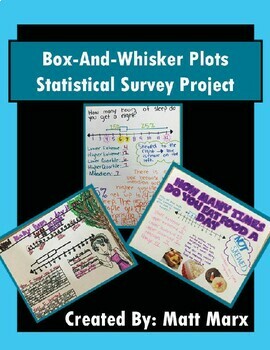
Box And Whisker Plots - Statistical Survey Project
Box-And-Whisker Plots - Statistical Survey ProjectThis Statistical Survey Project offers students the opportunity to demonstrate an understanding of Statistics content through the lens of a personalized statistical survey and the creation/study of a Box-And-Whisker Plot.Students insert themselves into their learning by selecting their own personalized survey question. Students have fun creating their posters, sharing them with the class, and having them displayed for all to see in the classroom.
Subjects:
Grades:
6th - 12th, Higher Education, Adult Education
Types:
CCSS:
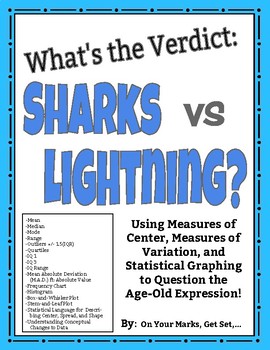
What's the Verdict: Sharks vs. Lightning? Modes of Center, Spread, and More!
Put it to the test! Use the age-old expression: "You are more likely to get struck by lightning than to be bitten by a shark!" to learn and practice Measures of Center, Measures of Spread, Measures of Shape, and Statistical Graphing including:MEANMEDIANMODERANGEOUTLIERS [Using IQR +/- 1.5(IQR)]QUARTILES [lower quartile (IQ-1) and upper quartile (IQ-3)]INTERQUARTILE RANGE (IQR)MEAN ABSOLUTE DEVIATION/ M.A.D. ft. ABSOLUTE VALUESYMMETRY/ASYMMETRY OF DISTRIBUTIONCLUSTERS AND GAPSBELL SHAPED CURVE AN
Subjects:
Grades:
5th - 12th, Higher Education, Adult Education
Types:
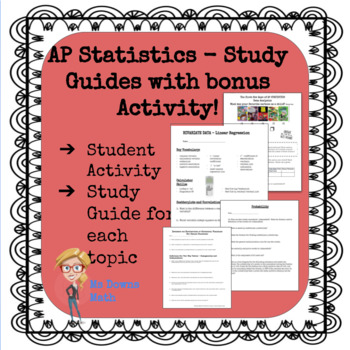
AP Statistics Study Guides - All Topics!
There is a pdf file study guide for each topic in the AP Statistics curriculum. Exploring Data, Normal Distributions, Linear Regressions, Experiments and Designing Studies, Probability, Random Variables, Sampling Distributions, Confidence Intervals, Hypothesis Tests, Comparing Populations, Chi Square Procedures, and Inference about Regression. I have students complete one for each unit. At the end of the year, they have a great study packet for the AP Exam! Student feedback has indicated that th
Subjects:
Grades:
9th - 12th, Higher Education, Adult Education
Types:
CCSS:
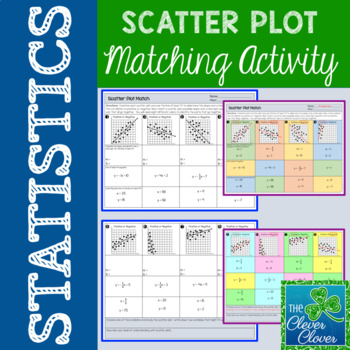
Scatter Plot Matching Activity
Scatter Plot Matching Activity
This resource allows students practice with scatter plots. Students will examine eight scatter plots. With each scatter plot, they will do the following:
✓ Identify if the scatter plot shows a positive or negative correlation
✓ Calculate the slope and determine the y-intercept
✓ Write the line of best fit equation
✓ Match a scatter plot, slope & intercept, line of best fit equation and possible coordinate pair
Students are asked to think of two variables t
Subjects:
Grades:
6th - 9th, Adult Education
Types:
CCSS:
Also included in: Scatter Plot Mini-Bundle
Create Your Own Statistics Project
This document contains a statistics project description that allows students to create their own project. This is suitable for high school and beginning level college statistics class. Students will design their own study - formulate research questions, collect data, organize and summarize the findings, calculate confidence interval and construct hypothesis testing. Certain restrictions are outlined in the document. Students will experience the complexity of constructing their own study. They ar
Subjects:
Grades:
10th - 12th, Higher Education, Adult Education
Types:
Stats Data: Models 5th Edition By David Bock, Paul Velleman_SOLUTIONS MANUAL
SOLUTIONS MANUAL for Stats: Data and Models 5th Edition by David Bock, Paul Velleman, Richard De Veaux and Floyd Bullard(COMPLETE CHAPTERS 1-26)TABLE OF CONTENTS:Chapter 1 Stats Starts Here Chapter 2 Displaying and Describing Data Chapter 3 Relationships Between Categorical Chapter 4 Understanding and Comparing Distributions Chapter 5 The Standard Deviation as Ruler and the Normal Model Chapter 6 Scatterplots, Association, and CorrelationChapter 7 Linear Regression Chapter 8 Regression Wisdom Ch
Subjects:
Grades:
Higher Education, Adult Education, Staff
Maze - BUNDLE Statistical Measures (Mean, Median, Mode, & Range)
This bundle includes a total of 6 mazes in addition to the popular handout "Data Analysis - Terms and Definitions (statistical measures definitions)". This handout and each of the mazes is sold separately at my store. Please visit the links below for more details about each individual product:
• Maze - Find the Mean
• Maze - Find the Median
• Maze - Find the Mode
• Maze - Find the Range
• Maze - Find Mean, Median, Mode, and Range
• Data Analysis - Terms and Definitions (statistical me
Subjects:
Grades:
6th - 12th, Higher Education, Adult Education
Types:
Psychology Random Sample Population Stats M&M Worksheet for Research Methods
Psychology or Statistics Random Sample & Population Statistics M&Ms Worksheet Activity for Research Methods includes a teacher direction sheet with materials that you need and how to complete the activity along with printable handout for students. *Student Favored activity*Please email me with any questions at ReadySetLearnSocialScience@yahoo.comIf you would like to get updates on NEW and CURRENT resources...►FOLLOW Me on Teachers Pay Teachers►FOLLOW Me on Pinterest►FOLLOW Me on Instagr
Subjects:
Grades:
4th - 12th, Adult Education
Types:
Showing 1-24 of 362 results


