33 results
Adult education statistics graphic organizers

Normal Distribution Foldable Popup
This is a popup of a normal distribution graph, showing students the probable spread of data within 1, 2, 3, and 4 standard deviations of the mean. The formulas for the population standard deviation and the sample standard deviation are both included. It is a great reference/graphic organizer for student notebooks and I have even had students who weren't in my class ask to join because they wanted this popup too. Useful for math or maths class, great for visual and kinesthetic learners, and
Subjects:
Grades:
9th - 12th, Higher Education, Adult Education
CCSS:
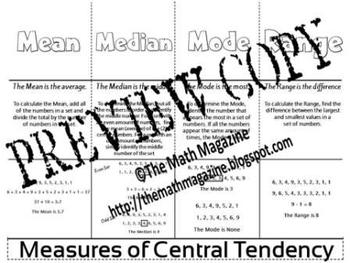
Measures of Central Tendency Mean Median Mode Foldable 6.SP.A.1, 7.SP.1, S-ID.2
Measures of Central Tendency Mean Median Mode Foldable 6.SP.A.1-3, 7.SP.1-4, S-ID.2
This is a single page PDF foldable that explains the Measures of Central Tendency: Mean, Median, Mode and Range.
The foldable includes: the definition of each term, an explanation of the correct ways to determine each and an example of each.
The folding directions are included with the purchased file.
BONUS: (2) FREE ITEMS are included as my way of thanking you for your interest in my items.
Follow me on T
Grades:
5th - 12th, Adult Education
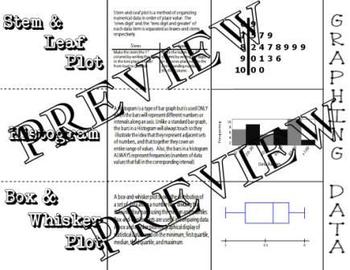
Graphing Data Histogram Box Whisker Stem Leaf Plot Foldable Interactive Notebook
Graphing Data Histogram Box Whisker Stem Leaf Plot Foldable Interactive Notebook
This is a single page PDF foldable that explains the differences in Histograms, Box and Whisker Plots and Stem and Leaf Plots, as well as shows an example of each.
The folding directions are included.
All feedback is welcomed
Follow Me on TpT!
Subjects:
Grades:
4th - 12th, Adult Education

Misleading Statistics
Did you know that 90% of all serial killers are right-handed?
Well, of course... 90% of all people in general are right-handed.
This is a great activity that can be used as an introduction to any statistics class or unit. It makes students think about how people misinterpret statistics and how two people can look at the same data and draw different conclusions.
Subjects:
Grades:
7th - 12th, Higher Education, Adult Education
Graphic Organizers for Statistics - ALL THREE PARTS
This is a combined package of all three parts of my Graphic Organizers for Statistics. It includes all the organizers from
Part I: Descriptive Statistics,
Part II: Sampling & Probability, and
Part III: Inferential Statistics.
Please see the individual products for more info.
Subjects:
Grades:
11th - 12th, Higher Education, Adult Education
Types:
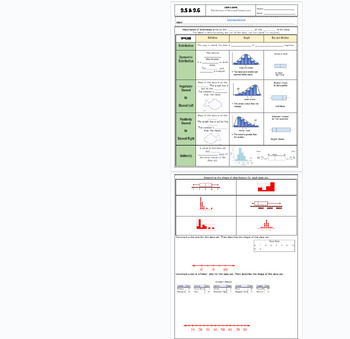
Data Distribution positive/negative skewed fillable notes UPDATED
Unit 9: Data and Stats: Updated(No 9.3/ Skip)9.5/9.6 Data Distribution (skewness)Students go over the vocabulary and complete the examples with the vocabulary scaffolded. Skewness is explained and how to identify it comparing data charts and box and whisker plots. Uses many visuals and examples to differentiate between that different graphs. Notes are scaffolded. Includes hook video hyperlinked on the "learning objective" title. Key is included and hyperlinked as a PDF in the heading highlighted
Subjects:
Grades:
6th - 12th, Higher Education, Adult Education
CCSS:
Also included in: Unit 9: Data and Statistics Fillable Notes
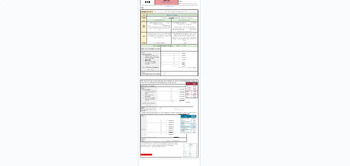
Standard Deviation Fillable Notes UPDATED
Unit 9: Data and Stats: Updated(No 9.3/ Skip)9.4 B Standard DeviationStudents go over the vocabulary and complete the examples with the vocabulary scaffolded. Standard deviation is long hand calculated by showing each step of the process (difference of squares). Real-world examples are explained in notes before calculating to show the importance of this stat and why it is used so often to verify valuable and effective data. Notes are scaffolded. Includes hook video hyperlinked on the "learning o
Subjects:
Grades:
7th - 12th, Higher Education, Adult Education
CCSS:
Also included in: Unit 9: Data and Statistics Fillable Notes
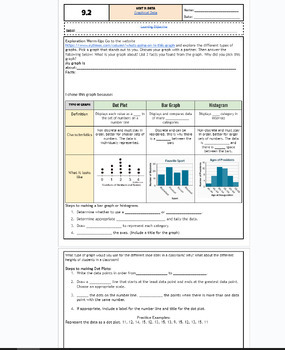
Graphical Data: Bar Charts, Dot Plots and Histograms fillable notes UPDTD
Unit 9: Data and Stats: UpdatedUpdated9.2 Graphs: bar, dot plot, histpgramStudents go over the vocabulary and define each type fo graph and what data fits for each graph. The warm up is an exploratory activity where students go on a website to search for their graph of interest and discuss the key findings. This takes around 10-15 mins and students enjoyed it! Notes are scaffolded. Includes hook video hyperlinked on the "learning objective" title. Key is included and hyperlinked as a PDF in the
Subjects:
Grades:
6th - 12th, Higher Education, Adult Education
CCSS:
Also included in: Unit 9: Data and Statistics Fillable Notes
2017-2018 AP Statistics Pacing Guide
With 2017-2018 AP Statistics Pacing Guide, your planning for the year is done! I've taken the standards and learning targets for AP Statistics and organized it for the year. It is one-sheet that is organized and user-friendly. You will know what to teach each day and know what topics are coming up. Non-teaching days are taken into account, such as testing, staff development days, etc. I hope that this helps you in your planning!Please review if you purchase! Thank you!Other 2017-2018 Mathematics
Subjects:
Grades:
9th - 12th, Higher Education, Adult Education, Staff
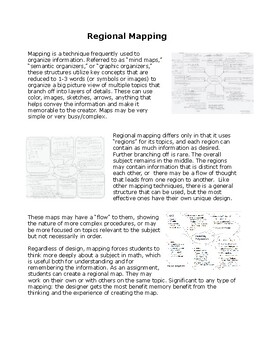
Regional Mapping Techniques and Examples
Mapping is a popular method for organizing information. There are limitations to the typical methods when applied to math/algebra. This Regional Mapping technique can be useful in math/algebra by organizing information in a manner that facilitates memorization.
Subjects:
Grades:
8th - 10th, Adult Education
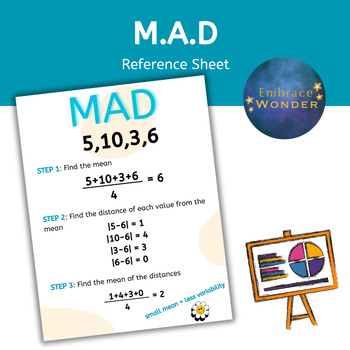
M.A.D Reference Sheet | Mean Absolute Deviation Graphic Organizer | Statistics
Teaching M.A.D? Is your classroom filled with the joy of students analyzing data and crunching numbers? Add this Mean Absolute Deviation Reference Sheet to your lesson collection. Also great for students in an IEP that require a graphic organizer in their lessons. Easy to print and project!What's included:1 PDF• Images are high resolution PDFs, perfect for printing and web use.---------------------------------------------------------------------------------------------------------------Let's Con
Subjects:
Grades:
5th - 12th, Higher Education, Adult Education, Staff
Graphic Organizers for Statistics 1 - Descriptive Statistics
These organizers, which are designed for the first part of a High School or Freshman College level course, delve into the concepts taught about Descriptive Statistics. This resource includes 15 blank organizers, 15 filled-in organizers (keys), notes about each organizers, and templates for making pie charts, bar charts, and scatterplots.
Subjects:
Grades:
11th - 12th, Higher Education, Adult Education
Types:
CCSS:
Graphic Organizers for Statistics 3 - Sampling Dist & Inferential Statistics
The organizers in this booklet will help your students grasp the concepts of inferential statistics faster and easier. While some of these 12 organizers help students mechanics involved in creating confidence intervals, most of the organizers are aimed at helping students visualize the underlying concepts involved in inferential statistics. Blank & Pre-answered organizers included along with a summary of hypothesis testing that synthesizes the process.
Subjects:
Grades:
11th - 12th, Higher Education, Adult Education
Types:
CCSS:

Graphic Organizers for Statistics 2 - Sampling & Probability
here are 17 organizers to assist you in teaching sampling and probability. Use them as note-taking guides while teaching, as worksheets to accompany textbook reading assignments, or as reviews for tests. Includes blank and pre-answered organizers, along with notes about each organizer. Includes organizers for finding probabilities on the TI Graping Calculators.
Subjects:
Grades:
11th - 12th, Higher Education, Adult Education
Types:

Key Performance Data Dashboards Bundle
Bundle includes presentation slides, printable graphic organizer for written practice, virtual graphic organizer for online practice, final project template and rubric.Student assignments are in three parts:Part 1: Print out KPI graphic organizer on 11x17 for students to draw sample charts showcased on presentation slides.Part 2: Virtual graphic organizer practice on Canva.Part 3: Final KPI Dashboard project Canva template.
Subjects:
Grades:
8th - 12th, Higher Education, Adult Education
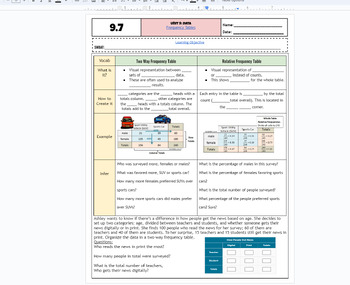
Frequency Tables & Relative Frequency Tables fillable notes UPDATED
Unit 9: Data and Stats: Updated(No 9.3/ Skip)9.7 Frequency Tables Students go over the vocabulary and complete the examples with the vocabulary scaffolded. Students examine a categorical table/frequency table and also use that information to create relative frequency tables. Different real-world examples and problems are used. Emphasized how percents and decimals are calculated. Notes are scaffolded. Includes hook video hyperlinked on the "learning objective" title. Key is included and hyperli
Subjects:
Grades:
6th - 12th, Higher Education, Adult Education
CCSS:
Also included in: Unit 9: Data and Statistics Fillable Notes

3 Types of Scatter Plots Graphs of Correlations Foldable Interactive Notebook
3 Types of Scatter Plots Graphs of Correlations Foldable Interactive NotebookThis is a (2) page PDF file pertaining to Positive, Negative and No Correlations when graphing data using scatter plots. The file contains the folding directions and images of the foldable once it was placed in an interactive notebook.Download the preview to see the foldable details and other images.Follow me on TpT as I periodically send samples to my followers!DID YOU KNOW???TpT Creditshttp://www.teacherspayteachers.c
Subjects:
Grades:
6th - 12th, Adult Education
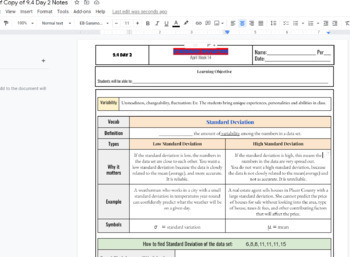
Standard Deviation Scaffolded Fillable Notes AND key
Standard Deviation Scaffolded Fillable Notes AND key, give definitions to the terms with real-world examples! Includes a video link in the notes as the intro to the lesson by describing the meaning and need for standard deviation in the simplest form possible! The key is linked at the top of notes as well that will download as a pdf- not a google doc- did not do the last problem on the bottom as it was an exit ticket for students (no layout).
Subjects:
Grades:
7th - 12th, Higher Education, Adult Education
CCSS:
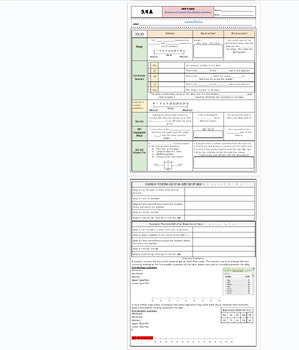
5 Number Summary and Box and Whisker Plots Fillable Notes UPDATED
Unit 9: Data and Stats: Updated(No 9.3/ Skip)9.4 A 5-number summary and box and whisker plot Students go over the vocabulary ad complete the examples with the vocabulary scaffolded. for each statistic with an explanation of the purpose of the 5 number summary and why these are used. Notes are scaffolded. Includes hook video hyperlinked on the "learning objective" title. Key is included and hyperlinked as a PDF in the heading highlighted in the orange box, and at the bottom of the google doc as w
Subjects:
Grades:
6th - 12th, Higher Education, Adult Education
CCSS:
Also included in: Unit 9: Data and Statistics Fillable Notes
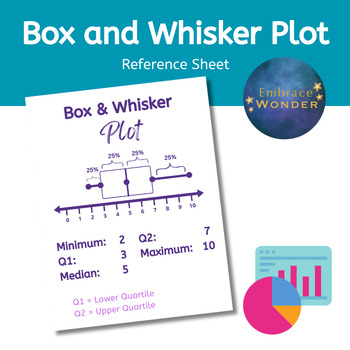
Box and Whisker Plot Reference Sheet | Graphic Organizer | Students on IEP
Teaching Statistics? Is your classroom filled with the joy of students analyzing data and crunching numbers? Add this Box and Whisker Plot Reference Sheet to your lesson collection. Also great for students in an IEP that require a graphic organizer in their lessons. Easy to print and project!What's included:1 PDF• Images are high resolution PDFs, perfect for printing and web use.---------------------------------------------------------------------------------------------------------------Let's C
Subjects:
Grades:
5th - 12th, Higher Education, Adult Education, Staff
CCSS:

Probability Reference Sheet | Probability Graphic Organizer | Students on IEP
Teaching Probability? Is your classroom filled with the sounds of students flipping coins and rolling dice? Add this Probability Reference Sheet to your lesson collection. Also great for students in an IEP that require a graphic organizer in their lessons. Easy to print and project!What's included:1 PDF• Images are high resolution PDFs, perfect for printing and web use.---------------------------------------------------------------------------------------------------------------Let's Connect!Tea
Subjects:
Grades:
6th - 12th, Higher Education, Adult Education, Staff
CCSS:
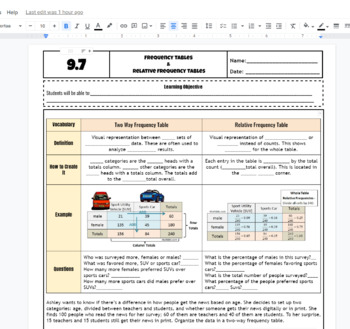
Two way frequency tables and relative frequency table scaffolded fillable notes
Two way frequency tables and relative frequency table scaffolded fillable notes with KEY included for Math 1 HS class. This can be used as a graphic organizer. 100 percent editable to your liking! Introduce the vocabulary with simple problems to finish out the tables and find the percentages of each category. This is an easy introduction lesson students can use for their understanding of frequency tables. You can add in conditional and marginal tables for deeper dive into the concept. Real-worl
Subjects:
Grades:
7th - 12th, Higher Education, Adult Education
CCSS:
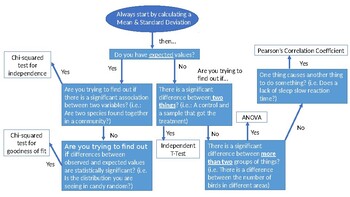
IB Biology: Internal Assessment Statistical Analysis Decision Tree
This product is a PowerPoint slide that can be modified to meet your needs and saved as a PDF to digitally provide to students. I had noticed that my students struggled with determining which statistical analysis was most appropriate for their Internal Assessment, so I created a decision tree for them. By being able to answer the questions on the decision tree, they will be able to appropriately analyze their data and reach their conclusion.
Subjects:
Grades:
11th - 12th, Higher Education, Adult Education
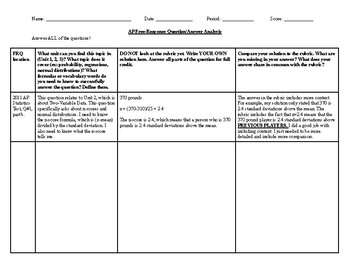
AP Free-Response Questions Analysis Graphic Organizer
Hi folks! This resource is a graphic organizer that you can use with any AP class that has a free-response section. For me, I use it in my AP Statistics class. The graphic organizer allows students to analyze each question on the FRQ section before answering the question. What topic do they need to know prior to answering the question? After students answer the question, they will compare their solutions to the rubric to see what they are missing or what they did well.
Grades:
9th - 12th, Higher Education, Adult Education
Showing 1-24 of 33 results


