279 results
12th grade statistics graphic organizers
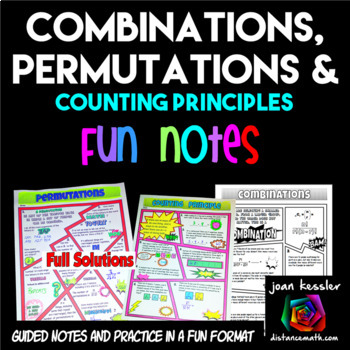
Permutations Combinations and Counting Principle FUN Notes Doodle Pages
Your students will love this Permutations, Combinations, and Counting Principle Fun Notes and Practice resource. Use it in class or as homework, assessment, or enrichment. A fun and engaging format for your students to learn the rules and practice their skills! Great for Algebra and Statistics.This resource contains 3 pages, one each for Permutations, Combinations, and the Fundamental Counting Principle. Students will complete a definitions and formula sections and complete over 20 problems.
Subjects:
Grades:
10th - 12th
CCSS:
Also included in: Algebra 2 FUN Notes Doodle Pages and Practice Bundle

Hypothesis Tests Introduction Statistics
My Statistics students always had trouble setting up the Null Hypothesis and the Alternative Hypothesis, and without understanding this, the tests and interpretations cannot be determined properly. Now I explain the unit and what Hypothesis Testing is all about first, and start them off with this set of notes and problems. At first they are excited not to do any math or calculations, but then the challenge begins.There are two sets of the problems, one multiple choice and the other mostly free
Subjects:
Grades:
9th - 12th
CCSS:
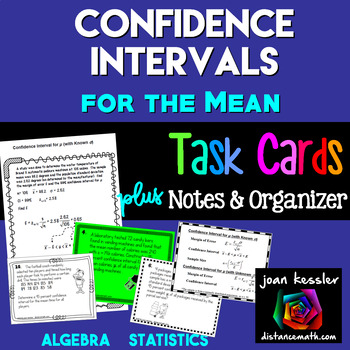
Confidence Intervals for the Mean
Your students will grasp Confidence Intervals for the Mean with this resource which includes Guided Notes, Task Cards, and a Graphic Organizer.What's Included?18 Task Cards for students to practice constructing confidence interval for the mean using the z - distribution and the t - distribution.Cards # 1 - 8 find Confidence intervals given statisticCards # 9 - 10 find Confidence intervals given dataCards # 11 - 12 find sample sizeCards # 13 - 15 find the margin of errorCards # 16 - 18 Given
Subjects:
Grades:
9th - 12th
CCSS:
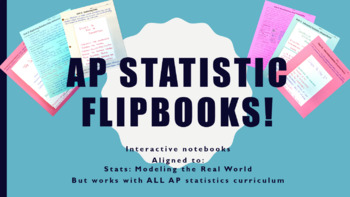
AP Statistics Flipbook Bundle! (Includes all objectives listed in 2019 CED!)
This resource has become a central focus of my class with overwhelmingly positive feedback from students, parents, and other teachers.
An interactive note page with "flipable" 3x5 cards summarizing the important data found in Bock, Velleman, De Veaux's (BVD) Stats: Modeling the World. This is applicable to ALL editions. May be used with all AP Statistics classes with minimum editing.
Included is an editable (word) document with the flipbook form (print on card stock for best results) and gradin
Subjects:
Grades:
10th - 12th
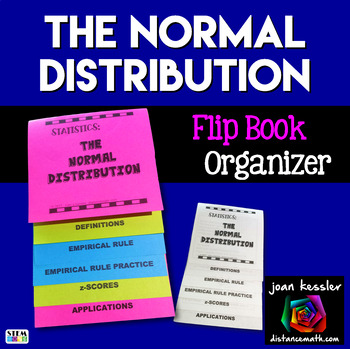
Normal Distribution Foldable Flip Book plus Practice
Your students will love this Normal Distribution Foldable Flip Book Organizer. Included are definitions, graphics, and 12 real life practice problems. Problems use both the Empirical Rule and z - scores. The problems that require z-scores use tables (included) or a graphing Calculator. The problems are challenging and will require your students to read carefully. I have also included a "cheat sheet" organizer for students' notebooks plus the tables (not part of flip book). Full solutions in
Subjects:
Grades:
9th - 12th
CCSS:
Also included in: Algebra 2 and PreCalculus Bundle of Foldables and Organizers
AP Statistics
This AP Statistics curriculum bundle contains the following (please take time to preview video and/or individual item previews):Guided Notes and Graphic Organizers (EDITABLE)Exhibition stations (slides) with guided notes (EDITABLE)ActivitiesProjects (EDITABLE)Exams (EDITABLE)Teacher's pacing guide and suggested order for each unit Review in AP style for preparation for the APCOMING: powerpoint with guided notes for each of 9 units NEW! UNIT 1 and UNIT 2 slides and editable notes are currently in
Subjects:
Grades:
10th - 12th
CCSS:
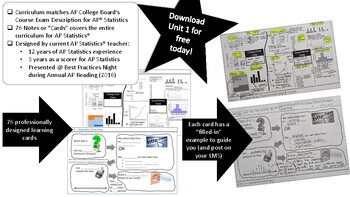
AP Statistics Learning Cards - Full Curriculum - Units 1 thru 12
AP Statistics' Learning Cards are professionally designed fill-in-the-blank cards that match the AP Statistics Course Description76 Learning cards in allWord documents provide 3 different formats to present to studentsPowerPoint presentation fileAll documents are editable
Subjects:
Grades:
9th - 12th
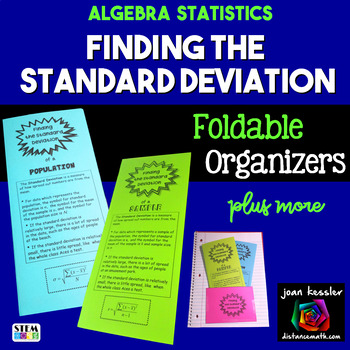
Standard Deviation Foldable Organizers for Statistics
This hands on resource is designed to help your students understand and evaluate the Standard Deviation from a set of data. Many students not only have a difficult time finding the standard deviation by hand, but also get confused with notation and whether they are finding the sample standard deviation or the population standard deviation. Included in the Lesson: Two Tri Fold handouts, one for the population standard deviation and one for sample standard deviation. Each foldable comes with
Subjects:
Grades:
9th - 12th
CCSS:
Also included in: Algebra 2 and PreCalculus Bundle of Foldables and Organizers
Statistics-Unit 1 Bundle: Introduction to Statistics
This bundle contains 3 lessons that introduce students to statistics. You can purchase this bundle with videos of the lessons as well. See my store. Lesson 1: Students will: -Be introduced to key vocabulary -Distinguish between a population and a sample -Distinguish between a parameter and a sample -Distinguish between descriptive statistics and inferential statisticsLesson 2: Students will: -Be introduced to key vocabulary -Determine if data are quantitative or q
Subjects:
Grades:
10th - 12th, Higher Education
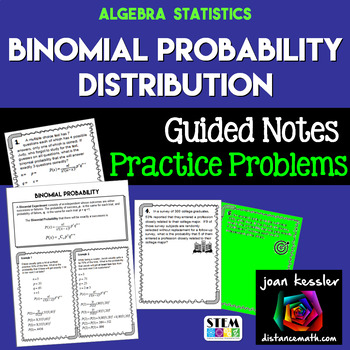
Binomial Probability Distribution Notes Practice Statistics
This Binomial Probability Distribution Guided Notes, Task Cards, and Practice Problem resource contains 4 smaller activities which will help your students determine Binomial Probabilities using the Binomial Probability Formula. The first part consists of Guided Notes with two completed examples. These examples are applications. The second activity can be used as Worksheets, Task Cards, or Stations and has eight applications to Binomial Probabilities. Full solutions included.Because teachers m
Subjects:
Grades:
9th - 12th
CCSS:
Also included in: Probability and Statistics Algebra 2 Unit 11 Activity Bundle
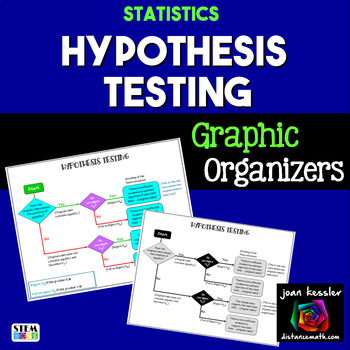
AP Statistics Hypothesis Testing Graphic Organizer
This Hypothesis Testing Graphic Organizer will help your students analyze and determine the correct wording for the results of a Hypothesis test. There are two versions of the organizers, one with H1 notation and the other with HA notation for the alternative Hypothesis. The preview only shows H1.There are five formats for the each of the version: Black and White, Color, with and without p -value info for rejection, and a two-to-a-page version as a paper saver. Please zoom in on the preview t
Subjects:
Grades:
9th - 12th
CCSS:
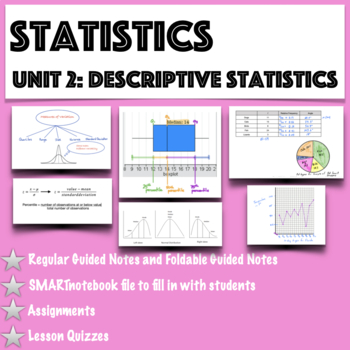
Statistics- Unit 2 Bundle: Describing Statistics
This is the second unit in my statistics curriculum. It contains 5 lessons. All lessons come with an assignment, quiz, and keys.Lesson 4: Frequency Distributions Students will: -Be introduced to key vocabulary -Create a frequency distribution -Make a histogram, a frequency polygon, and an ogiveLesson 5Students will: -Be introduced to key vocabulary -Graph quantitative using stem and leaf plots and dot plots -Graph qualitative data using a pie chart and pareto charts
Subjects:
Grades:
9th - 12th, Higher Education
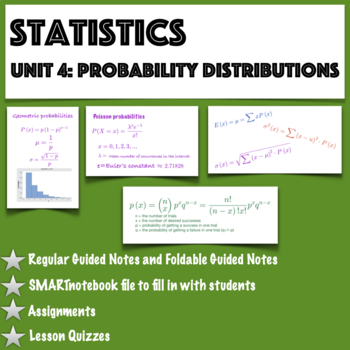
Statistics - Unit 4 Bundled: Probability Distributions
This bundle covers three lessons on Probability Distributions. -Lesson: Probability Distributions -Lesson: Binomial Distributions -Lesson: Geometric and Poisson DistributionsFor detalied information on lessons see the individual lesson descriptions.In addition to guided notes (foldable or regular guided notes), the following is included: -SMARTnotebook files for the teacher to fill in with the students -Homework/Classwork -Lesson quizzes -2 Tests© 2015 Angela Hogan “Stat
Subjects:
Grades:
9th - 12th, Higher Education
AP Statistics - Unit 2 Bundled: Descriptive Statistics (Growing Bundle)
This bundle will be updated with new improved notes, assignments, and daily quizzes that align with College Boards new course outline. Will be fully updated in July (2019).This growing bundle contains all of the lessons in the Descriptive Statistics Unit for AP Statistics. There are 13 lessons: -Analyzing Categorical Data (lesson 1) -Displaying Quantitative Data (lesson 2) -Using numbers to describe Quantitative Data (lesson 3) -Using numbers to describe Quantitative Data #2 (le
Subjects:
Grades:
9th - 12th, Higher Education
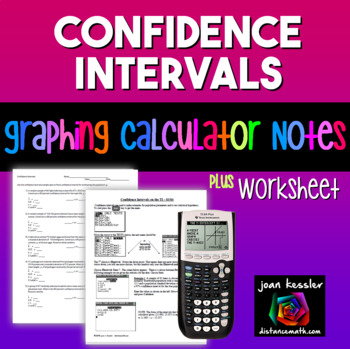
Statistics Confidence Intervals for the Mean TI 83 - 84 Reference Sheet plus HW
Confidence Intervals are not only part of AP Statistics and College Statistics, but are now included in Algebra 2 under Common Core. This resource helps students understand and succeed in determining confidence intervals to estimate a population mean using a TI 83 or TI 84 Graphing Calculator. Full step by step illustrated directions are given along with three examples.These notes can be used as Binder Notes or printed smaller for Interactive Notebooks.Also included is a handout with addition
Subjects:
Grades:
9th - 12th
CCSS:
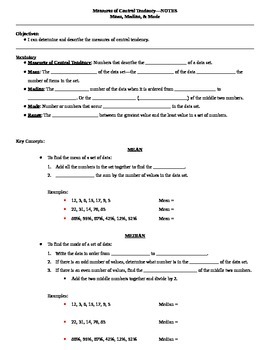
Measures of Central Tendency Guided Notes
These are guided notes for a lesson on measures of central tendency including mean, median, mode, and range. There are several examples in the notes and the same data sets are used to show each measure of central tendency.I have also included a teacher key to show you what to fill in the blanks as your students follow along.To use these notes, I simply projected them onto my whiteboard, gave the students their blank copies, and had them follow along and write what I wrote. This works great when
Subjects:
Grades:
5th - 12th
CCSS:
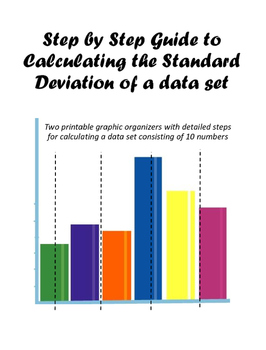
A Step-by-Step Guide to Calculating the Standard Deviation of a Data Set
This is set contains two standard deviation graphic organizers for students just introduced to the concept of standard deviations, students having trouble calculating the standard deviation of a data set, or students who require graphic organizers as a classroom accommodation.
The first organizer has a given data set (10 numbers total) and students fill in the boxes as they progress through each step of finding the standard deviation. The second does not give a data set, but is set up to wor
Subjects:
Grades:
9th - 12th
CCSS:

Statistics - Unit 6 -Confidence Intervals (Growing Bundle)
This bundle contains three lessons. -Lesson 1: Confidence Intervals for means -Lesson 2: Confidence Intervals for means (small samples) -Lesson 3: Confidence Intervals for proportionsThe lessons come as foldable guided notes or regular guided notes.These lessons contain key vocabulary. Students will calculate point estimates, find mimimum sample sizes needed to estimate the population parameters, and construct confidence intervals. Homework and a test are included.The lessons are set
Subjects:
Grades:
9th - 12th, Higher Education
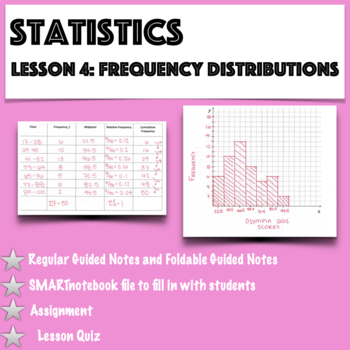
Statistics - Lesson 4: Frequency Distributions and their Graphs
This is the 4th lesson for an introductory statistics course and 1 of 5 lessons in this unit.Students will: -Be introduced to key vocabulary -Create a frequency distribution -Make a histogram, a frequency polygon, and an ogiveThere is another version of this lesson that comes with a video (see my store).In addition to guided notes (foldable or regular guided notes), the following is included: -SMARTnotebook file for the teacher to fill in with the students -Assignment to
Subjects:
Grades:
9th - 12th, Higher Education
Also included in: Statistics- Unit 2 Bundle: Describing Statistics
Statistics- Unit 5 Bundled: Normal Distributions (Growing Bundle)
Updated 2-6-2021 with quizzes for each lesson.This bundle consists of 4 lessons. In these 4 lessons students will:Interpret graphs of normal distributionsFind areas under the standard normal curveKnow how to find probabilities for variables that have a normal distribution using the table and technologyFind z-scores given an area under a normal curveFind a value given its z-scoreFind a value given a probabilityCalculate the mean, standard deviation, and probabilities of sampling distributionThese
Subjects:
Grades:
9th - 12th, Higher Education
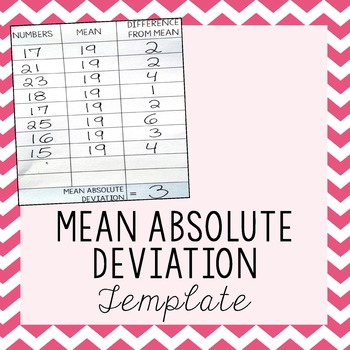
Mean Absolute Deviation Template
I created this template to help my students work through the steps of calculating Mean Absolute Deviation. The helped my students immensely and I hope it will help yours as well.I hope you will explore my other Mean Absolute Deviation products to help complete your unit:Mean Absolute Deviation MazeMean Absolute Deviation Activity with Zombies!Related Resourceso Click Here for more 8th Grade Math activitiesThis product is also part of the following money saving bundle:8th Grade Math Bundle - All
Subjects:
Grades:
6th - 12th
Types:
Also included in: 8th Grade Math Bundle ~ All My 8th Grade Math Products at 1 Low Price

Normal Distribution Foldable Popup
This is a popup of a normal distribution graph, showing students the probable spread of data within 1, 2, 3, and 4 standard deviations of the mean. The formulas for the population standard deviation and the sample standard deviation are both included. It is a great reference/graphic organizer for student notebooks and I have even had students who weren't in my class ask to join because they wanted this popup too. Useful for math or maths class, great for visual and kinesthetic learners, and
Subjects:
Grades:
9th - 12th, Higher Education, Adult Education
CCSS:
Graphic Organizers Bundle (AP Statistics)
This set of graphic organizers contains one graphic organizer for each main unit in the AP Statistics curriculum. The graphic organizers specifically follow the chapters in order for The Practice of Statistics (Yates, Moore, Starnes) Fourth edition, but of course, can be used to supplement any AP Statistics curriculum or textbook. Each graphic organizer page has all the key concepts for each unit conveniently on one succinct page, which makes it perfect for brainstorming, reviewing, and studying
Subjects:
Grades:
10th - 12th
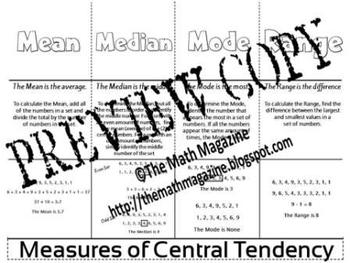
Measures of Central Tendency Mean Median Mode Foldable 6.SP.A.1, 7.SP.1, S-ID.2
Measures of Central Tendency Mean Median Mode Foldable 6.SP.A.1-3, 7.SP.1-4, S-ID.2
This is a single page PDF foldable that explains the Measures of Central Tendency: Mean, Median, Mode and Range.
The foldable includes: the definition of each term, an explanation of the correct ways to determine each and an example of each.
The folding directions are included with the purchased file.
BONUS: (2) FREE ITEMS are included as my way of thanking you for your interest in my items.
Follow me on T
Grades:
5th - 12th, Adult Education
Showing 1-24 of 279 results


