9 results
Kindergarten statistics graphic organizers
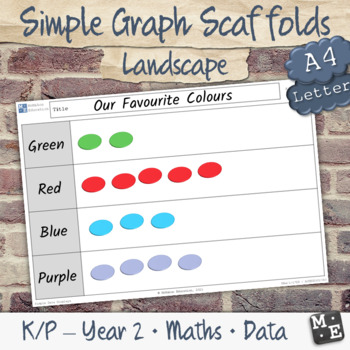
GRAPHING DATA Simple Picture Column Bar Graph Blank Scaffolds (Landscape)
Introduce students to arranging and representing data in rows or columns, with these printable graph scaffolds.By using these scaffolds students will:Use concrete materials, pictures or drawings as symbols to create data displays with one-to-one correspondenceGroup objects according to certain characteristicsArrange objects in rows or columns to form data displaysInterpret information presented on each data displayThis resource contains blank, A4/letter size scaffolds in landscape orientations:2
Subjects:
Grades:
K - 2nd
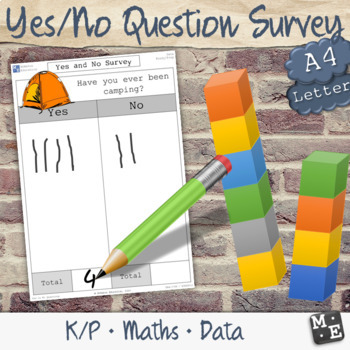
COLLECTING DATA Yes and No Survey Questions Worksheets
Get your students up and about as they conduct simple Yes and No surveys, gather and record factual data to build a source of information about the themselves and others in their immediate environment. These printable worksheets will provide a suitable scaffold with interesting and fun questions, that will prompt interpretive discussion about the similarities and differences between peer personalities and traits.By using these worksheets, students will collect information about themselves and th
Subjects:
Grades:
K
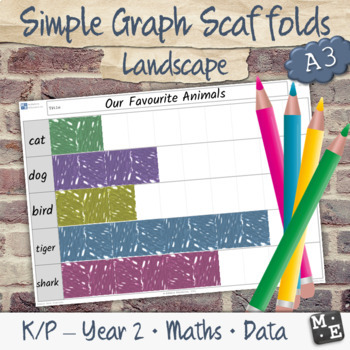
GRAPHING DATA Simple Picture Column Bar Graph Blank Scaffolds (A3 Landscape)
Introduce students to arranging and representing data in columns, with these printable graph scaffolds.By using these scaffolds students will:Use concrete materials, pictures or drawings as symbols to create data displays with one-to-one correspondenceGroup objects according to certain characteristicsArrange objects in rows or columns to form data displaysInterpret information presented on each data displayThis resource contains blank, A3 size scaffolds in landscape orientations:2,3,4,5,6,7, and
Subjects:
Grades:
K - 2nd
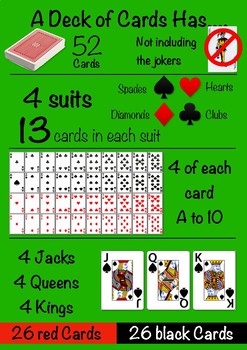
Chance, Statistics and Probability Playing Card Poster
This classroom display provides an engaging visual and supportive teaching aide for the teaching of probability facts related to a standard deck of playing cards.
Use this vivid resource to compliment your chance and probability lessons or simply to brighten up your mathematics display area.
Subjects:
Grades:
PreK - 12th
Types:
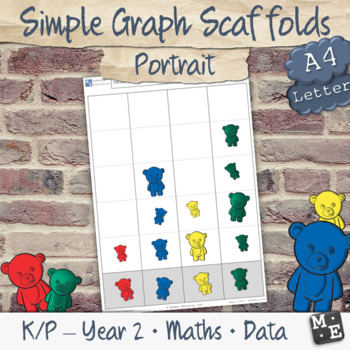
GRAPHING DATA Simple Picture Column Graph Blank Scaffolds (Portrait)
Introduce students to arranging and representing data in columns, with these printable graph scaffolds.By using these scaffolds students will:Use concrete materials, pictures or drawings as symbols to create data displays with one-to-one correspondenceGroup objects according to certain characteristicsArrange objects in rows or columns to form data displaysInterpret information presented on each data displayThis resource contains blank, A4/letter size scaffolds in portrait orientations:2, 3, 4 an
Subjects:
Grades:
K - 2nd
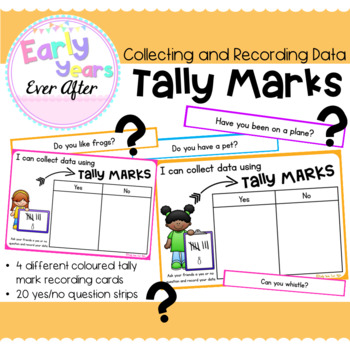
Tally Mark Collecting and Recording Data
Are your learners investigating data? Are they learning to ask yes and no questions to collect information? Are they experimenting with tally marks? This resource allows your students to work in groups to ask, collect and record data using tally marks. Simply print and laminate! There are 4 different coloured recording cards and 20 different yes/no question strips. Perfect for small group instruction when introducing tally marks or for use in centres and rotations. Like this product? Don't forge
Subjects:
Grades:
K - 2nd
CCSS:
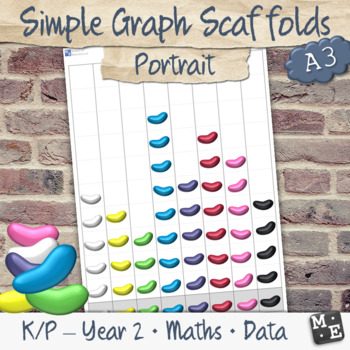
GRAPHING DATA Simple Picture Column Graph Blank Scaffolds (A3 Portrait)
Introduce students to arranging and representing data in columns, with these printable graph scaffolds.By using these scaffolds students will:Use concrete materials, pictures or drawings as symbols to create data displays with one-to-one correspondenceGroup objects according to certain characteristicsArrange objects in rows or columns to form data displaysInterpret information presented on each data displayThis resource contains blank, A3 size scaffolds in portrait orientations:2, 3, 4 and 5 col
Subjects:
Grades:
K - 2nd
Mathematics Planning and Assessment Organisation (F-2 Victorian Curriculum)
I made this resource based on experience as a classroom teacher and a Curriculum Team Leader for Foundation/Prep, as well as working in many, and leading a few, F-2 PLC meetings involving cycle of inquiries. One real challenge is understanding exactly where our students are working on the 3 mathematics continuums: number & algebra, measurement & geometry and statistics & probability. Once we identify students’ knowledge, skills and dispositions we then need to plan ‘just right’ learn
Subjects:
Grades:
K - 2nd

Sochi Olympic Medal Tally
A tally chart to keep track of Olympic achievement. Can be editted to fit classroom needs.
Subjects:
Grades:
PreK - 12th
Showing 1-9 of 9 results


