540 results
8th grade statistics internet activities
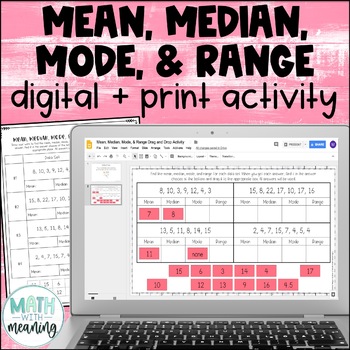
Mean, Median, Mode, & Range Digital and Print Activity for Google Drive
Looking for a fun, no-prep activity for finding mean, median, mode, and range? Students will find the mean, median, mode, and range for 4 data sets. They will then then find their answer from the answer choices at the bottom and drag it to the appropriate spot. Each data set contains 6-8 numbers. Please view the preview file to make sure that this activity is appropriate for your students.This product includes the following:A link to the digital activity on Google Slides including student direct
Subjects:
Grades:
5th - 8th
CCSS:
Also included in: Middle School Math Digital and Print Activity Bundle Volume 1
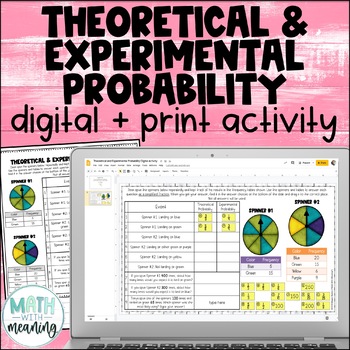
Theoretical and Experimental Probability Digital and Print Activity
Looking for an engaging, no-prep activity to practice working with theoretical and experimental probability? Students will use two sets of spinners and frequency tables to answer questions in this fun digital and print activity.This activity requires students to find the theoretical and experimental probabilities of simple events and to use theoretical probabilities to make predictions. Please view the preview file to make sure that this activity is appropriate for your students.This product inc
Subjects:
Grades:
5th - 8th
CCSS:
Also included in: Middle School Math Digital and Print Activity Bundle Volume 3
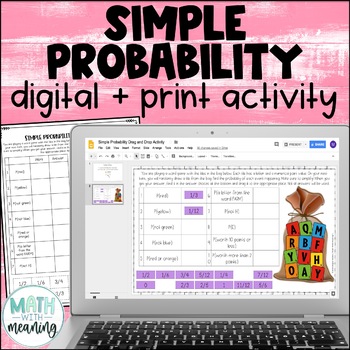
Simple Probability Digital and Print Drag and Drop Activity for Google
Looking for an engaging, no-prep activity to practice finding the probability of simple events? Students will use the included image to find the probability of 10 simple events. They will then find their answer from the answer choices at the bottom and drag it to the appropriate spot. Please view the preview file to make sure that this activity is appropriate for your students.This product includes the following:A link to the digital activity on Google Slides including student directionsA PowerP
Subjects:
Grades:
5th - 8th
CCSS:
Also included in: Middle School Math Digital and Print Activity Bundle Volume 1
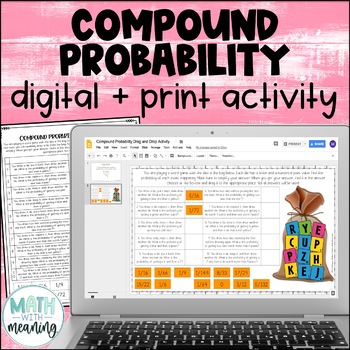
Compound Probability Digital and Print Activity for Google Drive and OneDrive
Looking for an engaging, no-prep activity to practice finding the probability of compound events? Students will use the included image to find the probability of 10 compound events, including both independent and dependent events. They will then find their answer from the answer choices at the bottom and drag it to the appropriate spot. Please view the preview file to make sure that this activity is appropriate for your students.This product includes the following:A link to the digital activity
Subjects:
Grades:
6th - 9th
CCSS:
Also included in: Middle School Math Digital and Print Activity Bundle Volume 1
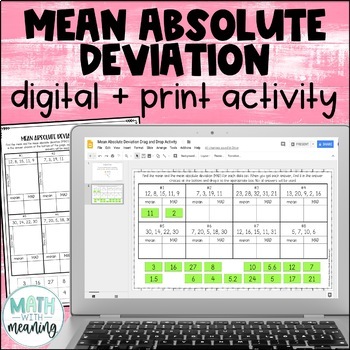
Mean Absolute Deviation MAD Digital and Print Activity for Google Drive
Looking for an engaging, no-prep activity to practice finding the MAD? Students will find the mean and mean absolute deviation for 8 data sets. They will then then find their answer from the answer choices at the bottom and drag it to the appropriate spot. Each data set contains 4-5 numbers. The mean of each data set is a whole number. Please view the preview file to make sure that these types of problems are appropriate for your students.This product includes the following:A link to the activit
Subjects:
Grades:
6th - 9th
CCSS:
Also included in: Middle School Math Digital and Print Activity Bundle Volume 2
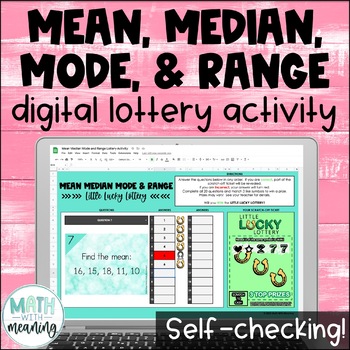
Mean Median Mode and Range Self-Checking Digital Activity - Measures of Center
Looking for a fun self-checking activity to practice finding mean, median, mode, and range? Students will solve 20 problems in this engaging, no-prep digital lottery activity!Each data set includes 4-8 numbers. The answer to each problem is a whole number. There are problems where there is no mode. Please look at the preview file to see if these types of problems are appropriate for your students.In this activity, students will answer questions in order to scratch off their digital lottery ticke
Subjects:
Grades:
5th - 8th
Types:
CCSS:
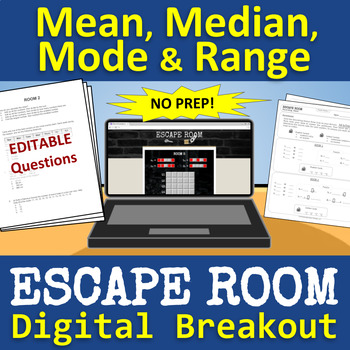
Mean, Median, Mode & Range ESCAPE ROOM - Digital Breakout | Distance Learning
Students will have a blast trying to break out of this escape room! There are 5 digital rooms with fun puzzles that engage students and challenge their problem-solving skills while they practice math content (mean, median, mode and range). Great for team-building! Quick and easy setup. Includes 100% digital option! CLASSROOM SETUP:Print/copy the math questions for each group.Print/copy the recording sheet for each student.Provide a device for each group (the Escape Room link is on the recording
Subjects:
Grades:
6th - 8th
Also included in: Math Escape Room - Digital Breakout - BUNDLE
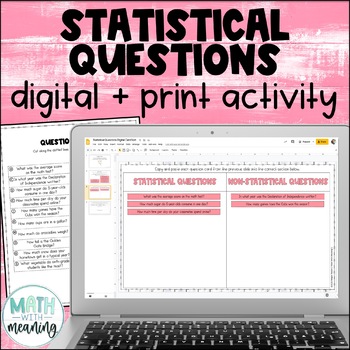
Statistical Questions Digital and Print Card Sort for Google Drive and OneDrive
Looking for an engaging, no-prep activity to practice identifying statistical and non-statistical questions? Students will read 20 questions and determine if they are statistical or non-statistical questions in this fun digital and print card sort activity. They will also choose a topic and write one one of each type of question of their own about that topic.Please view the preview file to make sure that this activity is appropriate for your students.This product includes the following:A link to
Subjects:
Grades:
5th - 8th
CCSS:
Also included in: Middle School Math Digital and Print Activity Bundle Volume 3
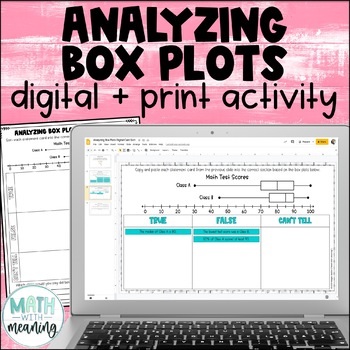
Box and Whisker Plot Digital and Print Card Sort - Reading and Analyzing
Looking for an engaging, no-prep activity to practice reading and analyzing box plots? Students will look at a double box plot and determine if statements about it are true, false, or if they can't tell from the information given in this fun digital and print activity.This activity includes statements about the minimum, maximum, median, quartile 1 (Q1), quartile 3 (Q3), interquartile range (IQR), and range of the box plots, along with statements about the percentages represented by a particular
Subjects:
Grades:
6th - 9th
Also included in: Middle School Math Digital and Print Activity Bundle Volume 3
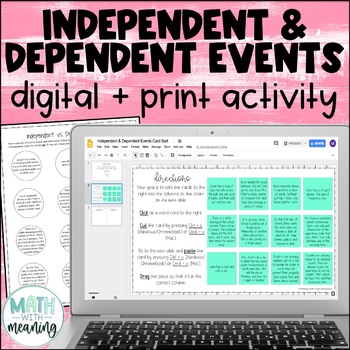
Independent and Dependent Events Digital Print Card Sort - Compound Probability
Looking for an engaging, no-prep activity to practice identifying independent and dependent events? Students will read 12 sets of compound events and determine if they are independent or dependent events. Many examples of real-world events are included. This is a great activity for students learning compound probability who struggle with differentiating between independent and dependent events. Also included is a printable graphic organizer that is perfectly sized for interactive notebooks. Plea
Subjects:
Grades:
6th - 9th
CCSS:
Also included in: Middle School Math Digital and Print Activity Bundle Volume 2
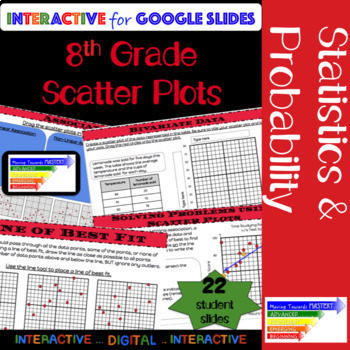
8th Grade Math Scatter Plot: Guided Interactive Lesson
Extensive ALL digital guided lesson for constructing and interpreting scatter plots.The slides are scaffolded to build understanding. Students will progress from identification of terms to making predictions involving bivariate data. The guided slides will begin with identification, move towards assisted analysis, and conclude with independent practice.Slides include...♦ Definitions and Visual Representations♦ Identification and Use of Terms→ Bivariate Data→ Scatter Plot→ Linear, Nonlinear, &
Subjects:
Grades:
8th - 10th
Types:
CCSS:
Also included in: 8th Grade Math Common Core Growing Bundle
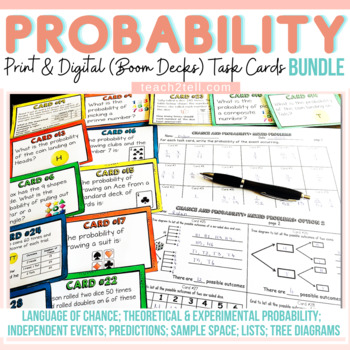
Theoretical Probability Activities Print Digital Task Cards Boom Cards Bundle
Are you teaching your students all about Theoretical Probability and looking for fun hands-on Chance and Probability activities? This print and digital (Boom Decks) bundle of 192 probability task cards will reinforce the understanding of theoretical probability, experimental probability, language of chance, sample space, predictions, lists, tree diagrams and independent probability events.Please see the preview file for more information.Both US and British English spelling and terminology includ
Subjects:
Grades:
4th - 8th
Types:
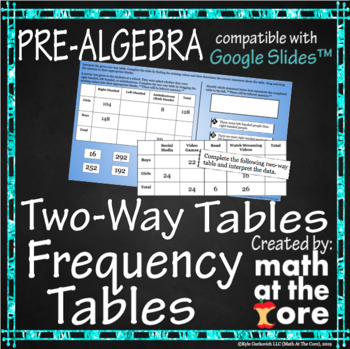
Two-Way Tables - Frequency Tables for Google Slides™
- Great for online and distance learning! Created to be compatible with Google Slides™!- In this digital activity, students will construct and interpret two-way frequency tables.- This activity includes 31 different problems involving two-way frequency tables. Students will start with determining which statements about a given frequency table are true and which are false. They will then have to analyze the table and fill in the missing blanks to make the table correct and complete. The problems
Subjects:
Grades:
7th - 8th
Types:
CCSS:
Also included in: Statistics - Unit 7 - BUNDLE for Google Slides™
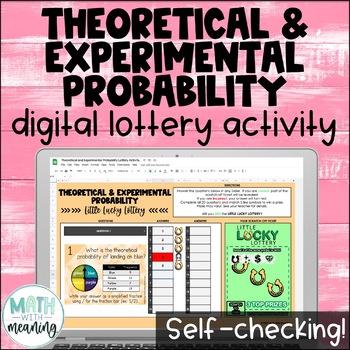
Theoretical and Experimental Probability Self-Checking Digital Activity
Looking for a fun self-checking activity to practice working with theoretical and experimental probability? Students will use spinners and frequency tables to answer 20 questions in this engaging, no-prep digital lottery activity!This activity requires students to find the theoretical and experimental probabilities of simple events and to use theoretical probabilities to make predictions. Please view the preview file to make sure that this activity is appropriate for your students.In this activ
Subjects:
Grades:
5th - 8th
Types:
CCSS:
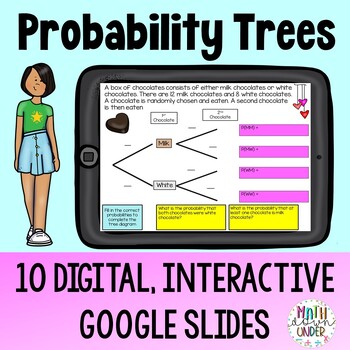
Probability Tree Diagrams Practice - Digital Activity using Google Slides
This resource is a set of 10 Google Slides that practices Probability Tree Diagrams. Complete with attractive graphics, students will solve compound probability problems (independent and dependent events included) by filling in the missing spaces on a probability tree. Starting with structured scaffolding, students are introduced to the process of creating probability trees by clicking and filling in the blanks on the Google Slide. This approach builds confidence and ensures students grasp the f
Subjects:
Grades:
6th - 9th
Also included in: Probability Tree Practice Bundle - PDF & Digital
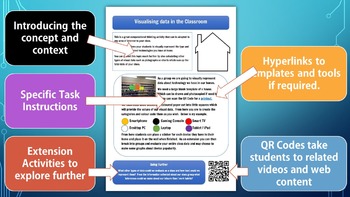
Computational Thinking & Data Analysis Task Cards | STEM | Digital Technologies
Most kids don’t naturally think like PROGRAMMERS, but you can enjoy the satisfaction of seeing them have a COMPUTATIONAL THINKING ⚡“A-ha!”⚡ moment as they learn with these visual, hands-on, NO PREP STEM activities.For those students who learn best by seeing, doing, and getting their hands dirty, this activity and card set will make abstract computing concepts as real as the classroom they’re sitting in. This pack uses students’ everyday interests, such as sports and friends, to teach them how al
Grades:
3rd - 8th
Types:
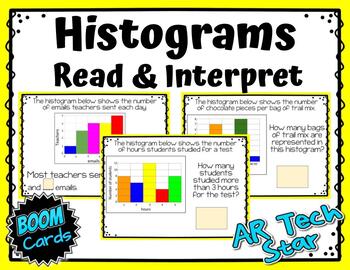
Histograms - Read & Interpret Boom Cards - Distance Learning
This set of 20 Boom Cards provides practice for reading and interpreting histograms. Students are given a graph and question on each card. When they type their answers in the box and click submit, they will receive instant feedback!Boom Cards are perfect for:✅ Independent Practice✅ Small Group✅ Interventions✅ Homework✅ Morning Work✅ Centers✅ Fast Finishers✅ Inside Recess✅ Just for Fun!!Don't have 1:1 devices? No problem! Boom Cards can also be printed!! Use as task cards or as a write the room
Subjects:
Grades:
5th - 8th
Types:
CCSS:
Measures of Center and Spread |Mean, Median, Standard Deviation, +|Google Forms™
Included in this Product: 100% Self-Grading Assessment or Homework using Google Forms™ - Measures of Center and Spread - Mean, Median, Range, Interquartile Range, Standard Deviation - 26 Questions each (9 multiple choice, 15 free response, and 2 checkbox). The default multiple choice answer order is generally set to be "shuffled" to prevent cheating. However, this can be edited. 2 similar versions for the price of 1!! Having a second version of the form allows for retakes and also gives you opt
Subjects:
Grades:
8th - 12th
Types:
CCSS:
Also included in: Algebra 2 Google Forms™
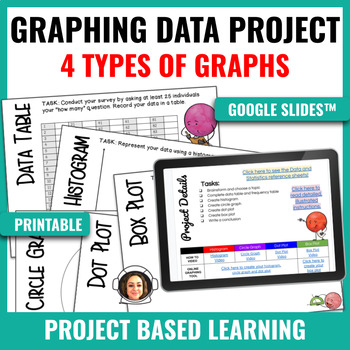
Graphing Data PBL - Histogram, Circle, Dot Plot, Box Plot
About this resource:This project takes students through the process of writing and conducting an original survey, then creating multiple representations of their data. Students will practice creating a histogram, circle graph, dot plot and box plot. Students will access "how to videos" as well as "online digital tools" that enable them to create the four graphs digitally. In the Google Slides™ version, support links are available for vocabulary references and data and statistics anchor charts. S
TEK 8.5D Making Predictions on Scatter Plots for Google Classroom™ & Boom Cards™
Are you looking for a fun activity that covers Math TEK 8.5D which is flexible enough to be a hit with your students whether you are in the classroom or teaching remotely? If that sounds like something you'd be interested in, you are going to fall in love with our super-flexible digital & printable combination task card sets. These making predictions on scatter plots digital activities are one-click away from being loaded as (1) self-graded Google Forms, (2) Google Slides, (3) Boom Cards,
Subjects:
Grades:
7th - 8th
Types:
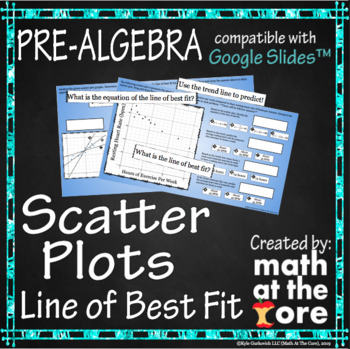
Scatter Plots - Line of Best Fit for Google Slides™
- Great for online and distance learning! Created to be compatible with Google Slides™!- In this digital activity, students will analyze scatter plots and determine the line of best fit. They will use the line of best fit and the equation of that line to predict values. They should be familiar with writing the equation of a line.- This activity includes 20 different problems involving analyzing scatter plots. Students will start with determining which line is the line of best fit for the given s
Subjects:
Grades:
7th - 9th
Types:
Also included in: Statistics - Unit 7 - BUNDLE for Google Slides™
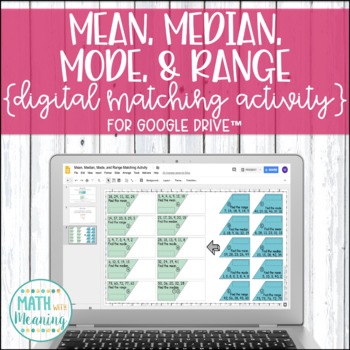
Mean, Median, Mode, & Range DIGITAL Matching Activity Distance Learning
This is a digital version of my Mean, Median, Mode, & Range Matching Activity created for use in Google Drive™. No cutting necessary!Students will practice finding mean, median, mode, and range with this fun self-checking matching activity! Students will solve 20 problems and make matching sets of cards that have the same solution. Each data set contains 4-7 numbers. All answers are whole numbers. Please view the preview file to make sure that these types of problems are appropriate for your
Subjects:
Grades:
5th - 8th
Types:
CCSS:
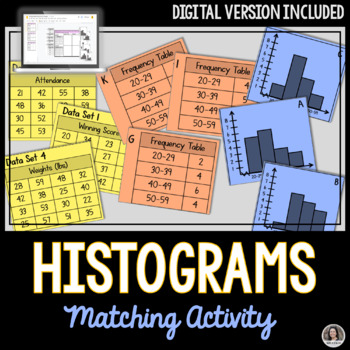
Histograms Matching Activity, Print and Digital Google Slides™
Practice makes perfect! This matching histograms activity is an ideal assignment for students to demonstrate their understanding of Histograms. Students match the data set to their corresponding frequency tables and histogram graphs. There will be 6 matches made when complete. Included:A pdf with a link to make a copy of the Interactive Google Slides™ for your own Google Drive™A printable version for students to sort and match.Student Response SheetAnswer keyDigital Version:Go paperless with thi
Subjects:
Grades:
7th - 12th
Types:
Probability & Statistics ★ Math TEK 7.6A 7.6C 7.6D 7.6E 7.6F 7.6G 7.6H & 7.6I
Are you looking for a unit's worth of engaging printable & digital activities that cover the 7.6 TEKS Math Domain (Probabilistic and Statistical Proportionality)* while being immediately implementable in printable and digital formats? If that sounds like something you might be interested in, I'm confident this product is going to meet and exceed your expectations!*Currently Math TEK 7.6B is not included in this bundle as it is not part of the assessed curriculum and is a very difficult stand
Subjects:
Grades:
7th - 8th
Types:
Showing 1-24 of 540 results


