71 results
8th grade statistics homeschool curricula

Math Mammoth Grade 8 Complete Curriculum
Math Mammoth Grade 8 is a complete math curriculum for 8th grade mathematics studies. It contains some typical algebra 1 topics, but not all (based on the Common Core Standards for 8th grade (CCS)). You could classify it as an in-between course between traditional pre-algebra and algebra 1.At the heart of the curriculum are two student worktexts (A and B), each covering about half a year of math work. These worktexts contain all the instruction and the exercises in the same book — which make
Subjects:
Grades:
8th
Also included in: Math Mammoth Grades 5-8 Bundle
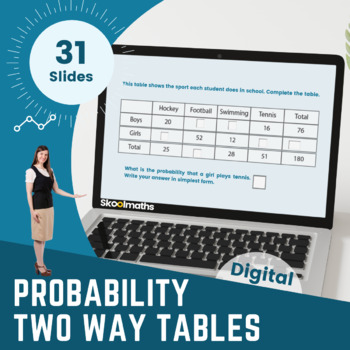
Conditional Probability | Two Way Tables | Digital Lesson CCSS.HSS-CP.A.1
Conditional Probability - Two Way Table is a completely interactive lesson designed for High School learners. Buy this great value bundle of interactive probability activities today to save you hours of planning and don't forget to leave an honest review if you download this digital probability resource for TPT credit :)This lesson will teach your maths class how to calculate the probability for two events. What they will learn:How to read the information given in a two-way table and answer rel
Subjects:
Grades:
7th - 10th
CCSS:
Also included in: Complete Statistics and Probability Bundle | Digital and Print

Roll That Die (Experimental and Theoretical Probability)
This activity is done in pairs. Each person needs a copy of the worksheet and each pair needs one die. If you have felt (used to help reduce noise) hand out one piece to each pair.
The pairs will read the worksheet and complete the activity. They will roll a die and record the results and then compare the experimental probability with the theoretical probability.
When the students have completed the activity, go over the fill-in the blank questions as well as the last three questions.
Subjects:
Grades:
6th - 8th
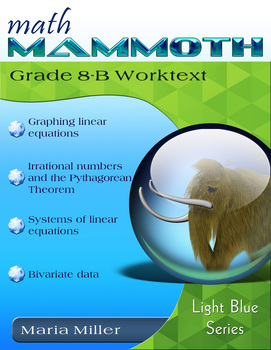
Math Mammoth Grade 8-B Curriculum
Math Mammoth Grade 8-B is a complete math curriculum for the latter half of 8th grade mathematics studies, based on the Common Core Standards for 8th grade (CCS)).At the heart of the curriculum is the student worktext. The worktext contains all the instruction and the exercises in the same book — which makes lesson preparation a breeze. The worktext is written directly to the student, and thus allows many students to teach themselves and to learn directly from the text.You will also get a separa
Subjects:
Grades:
8th - 9th
High School Statistics and Probability Bundle
High School Statistics and Probability PacketThis amazing statistics and probability bundle is all you need for your middle school to High school learners. From calculating averages using frequency tables to condition probability, your learners are definitely going to be immersed in their learning! Buy this high-engagement math bundle today and save hours of lesson planning time.Interactive Digital lessons inside this bundle include:Measures of Central tendencyConditional Probability - Venn Diag
Subjects:
Grades:
7th - 12th
Food Justice, Food Sovereignty and the Zero Mile Meal; Food & Math
This is one in a continuing series of activities that takes mathematics and applies it to social issue, including Food Waste and Mathematics: From Farm to Table to Dump, Mathematics, Demographics & Slavery: The 1790 Census in Ratio, Percents & Graphs, MathBusters: Percentage Practice to Analyze 2016 Election Results, and Statistics, Histograms and Lies Presidential Candidates Tell. In this case, we are looking at how far food must travel in order to make it from where it is produced to t
Subjects:
Grades:
5th - 12th
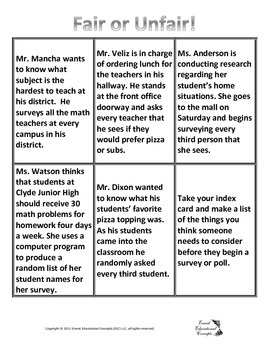
Fair or Unfair (Understanding Bias in Surveys)
Copy the teacher cards and cut them out. You can read them aloud during the activity, or put them under a document camera.
Copy the “fair” and “unfair” pages on two different colors of paper. This way you can easily monitor the students’ answers.
Have students hold up the card “Fair” or “Unfair” to show their answer to the card you read.
If the class is split with their answers, ask why students selected the answer they chose. If the answer is “unfair” talk about why it is “unfair”.
Ask th
Subjects:
Grades:
6th - 12th
Introduction to Statistics (DS1): S.IC.A.1, S.ID.A.1
Students will begin to explore statistics by collecting and processing data using the mean, median and mode. This mission is aligned with Common Core State Standards: HSS.IC.A.1, HSS.ID.A.1.
The fun stuff:
Numbers, numbers everywhere but don't forget to stop and think! Now more than ever the world is awash in data and statistics. Students consider the practice of statistics and what a statistic is by debating the number of hours of sleep they need, the age at which the brain reaches full maturi
Subjects:
Grades:
7th - 12th
CCSS:
My Entire Algebra Curriculum
The Number System, Expressions and Equations, Algebra, Linear Functions, Data and Statistics. A comprehensive introduction to Algebra. These missions are aligned with Common Core Standards from the categories Number and Quantity, The Number System, Expression and Equations, Algebra, Functions, Statistics and Probability. Now with four additional missions on Exponential and Quadratic Functions at no additional cost!
The Whole Enchilada! Delicious math morsels for small groups to share. Base jum
Subjects:
Grades:
7th - 12th
Types:
Blocking D and I (Independent and Dependent Probability)
This is a two player game and each player will need a crayon. Make sure that the crayons they use are different colors.
Each pair will have one Blocking D & I Sheet and a baggie full of Blocking D & I Cards. Have them take out the cards and turn the cards face down. Tell the students to play Rock Paper Scissors to see who goes first.
The goal is to have their color either in a word that spells "independent" or a word that spells "dependent".
If they pull a card and correctly identify
Subjects:
Grades:
6th - 8th

Probability of Mutually Exclusive Events
Probability of Mutually Exclusive EventsWant an interactive math lesson for your 6th to 8th-grade math classes that will help them understand the Probability of Mutually exclusive Events? Buy this great value bundle of interactive probability lessons with engaging self-marking activities today to save you hours of planning and don't forget to leave an honest review if you download this proportional relationship digital math resource for TPT credit :)In this fun-packed lesson, your students will
Subjects:
Grades:
7th - 8th
Also included in: High School Statistics and Probability Bundle
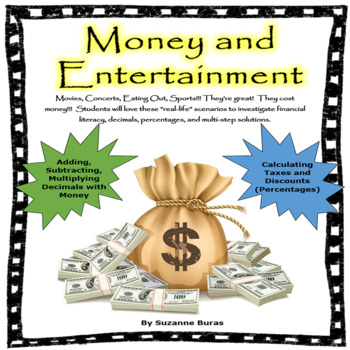
Money and Entertainment: Multi-Step Scenario Task Cards (Decimals,Percentages)
This product is about money, decimals, discounts, taxes, percentages, multiple-step problems, and financial literacy!! I truly hope you and your students will enjoy and benefit from it! Perfect tasks for stations/centers or enrichment!The packet includes four task cards and four information cards on different types of entertainment: NFT Game Time A Night at the Movies An Evening at the Symphony Dinner Out at Billy Bob Joe’s Pizza ShopThese tasks focus on expenses incurred for a fun time of ente
Subjects:
Grades:
5th - 8th
Data and Statistics (DS) Bundle
Shape, center and spread, the normal distribution, sampling and linear regression are all explored in this introduction to statistics. These missions are aligned with Common Core Standards from the Statistics and Probability category for 8th grade and high school.
The fun stuff:
Heart rates and marathons, coins and NBA heights, this bundle gives students the chance to explore shape, center, and spread with coins, dice, heights, shoe sizes and more. They also explore linear regression and even
Subjects:
Grades:
7th - 12th
CCSS:

Choose Your Measure? (Central Tendencies and Range)
Copy the teacher cards and cut into four sections. Review mean, median, mode and range with the students. Students will need their pencil and a piece of scratch paper.
Either make a transparency, pull up on a Smart Board or put one of the cards under a document camera.
Students will determine which measure they would want the teacher to use in determining their final average.
Tell the students to hold up the card that matches their answer.
Subjects:
Grades:
5th - 8th
Olympic Sprint Records: Using Decimals to Understand and Predict Records
Since the first modern Olympics in 1896, runners in the 100 meter sprint have been setting records on a regular basis, earning the title of the "fastest human on earth." How long can these records be broken? Will there eventually be a runner who can do the 100 meter sprint in just a few seconds? This activity shows students how the change from measuring time from tenths of a second to hundredths of a second allowed more records to be broken, and that by graphing these records, the new records ca
Subjects:
Grades:
5th - 9th
What is the Value of a Hit? The Mathematics of Baseball using Ratios & Percents
Are you interested in developing your students' understanding of decimals and statistics using baseball? This activity focuses on the skills of computing and comparing batting averages, as well as seeing what effect a "hit" can have on a player's average; that is, a player with fewer "at bats" will get a bigger "bump" from a hit, than a player with many at bats. This activity encourages students to see that a single statistic cannot tell you everything about the quality of a baseball player.
Subjects:
Grades:
5th - 8th
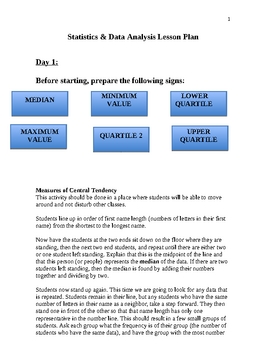
Up and Moving With Data Analysis and Statistics
Get your students up and moving as they create living graphs and actively find the median, mode, range, minimum and maximum values, upper and lower quartiles and never forget how they formed a box and whisker graph. Students will then collaborate on a survey project which will explore line plots, line graphs, bar graphs, histograms, circle graphs, scatter plots and stem and whisker plots. The unit will culminate with a discussion on biased questions and misleading graphs. A detailed rubric is at
Subjects:
Grades:
5th - 8th
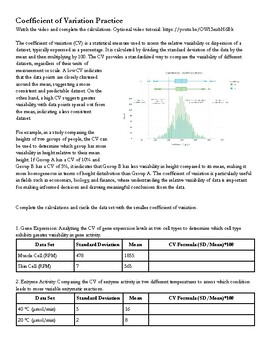
Coefficient of Variation Practice
Optional video tutorial: https://youtu.be/OW13nxbH6BkStudents calculate coefficient of variation based on given standard deviation and mean for various problem sets.
Subjects:
Grades:
6th - 12th
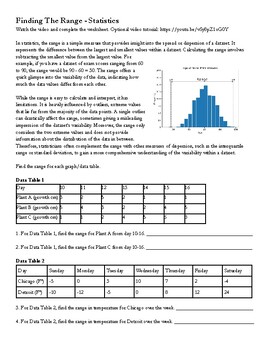
Finding The Range - Statistics
Optional video tutorial: https://youtu.be/vSy8pZ1oG0YStudents find the range from several different data tables and graphs.
Subjects:
Grades:
6th - 12th
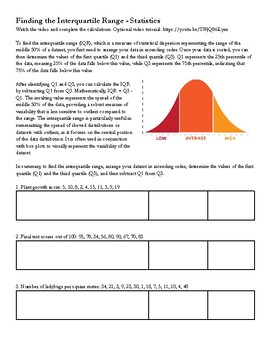
Finding the Interquartile Range - Statistics
Optional video tutorial: https://youtu.be/SWjQ86iLynsStudents use sample sets to find the interquartile range.
Subjects:
Grades:
6th - 12th
Probability of chance events using number lines fractions percents
Get students started in probability by helping them understand that probability of chance events can be expressed in terms such as impossible, unlikely, equally likely, likely and certain. CCSS 7.SP.5 - They'll learn that probability can also be described by a number from zero to one. Included are two/ activities/worksheets to help you start your students in their first formal introduction to probablity.
Please rate my work and provide feedback!
Terri Feil
Subjects:
Grades:
5th - 9th
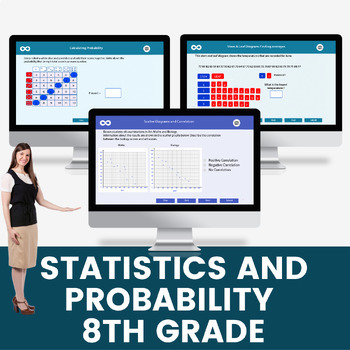
Statistics and Probability Digital Math Lesson and Activities Bundle
This amazing 8th Grade Statistics and Probability Digital Math Lesson and Activities is all you need for your 8th grade math class. From calculating averages using frequency tables to conditional probability, your learners are definitely going to be immersed in their learning! Buy this high-engagement math bundle today and save hours of lesson planning time.Interactive Digital lessons inside this bundle include:Measures of Central TendenciesConditional Probability - Venn DiagramsConditional Prob
Subjects:
Grades:
7th - 8th
The Normal Distribution (DS3): HSS.ID.A.3
Students will explore the normal distribution through real-world examples and the binomial distribution as number of experiments increases. Students will connect frequency plots to their corresponding probability distributions, and explore the shape, center and spread with the mean and provided standard deviation. This mission is aligned with Common Core State Standards: HSS.ID.A.3.
The fun stuff:
Candies, NBA players and sodas! But especially candies--the kids will take samples of candies in o
Subjects:
Grades:
7th - 12th
CCSS:
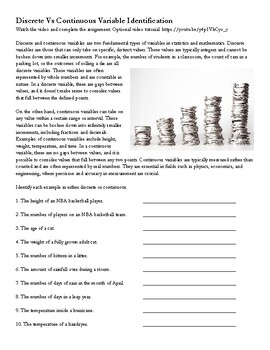
Discrete Vs Continuous Variable Identification
Optional video tutorial: https://youtu.be/y4p1VhCyo_cStudents identify data as either discrete or continuous.
Subjects:
Grades:
6th - 12th
Showing 1-24 of 71 results


