911 results
8th grade statistics lessons
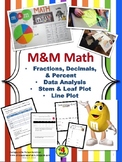
Theoretical and Experimental Probability M&M activity
Students need to find the probability of picking certain colored M&Ms, and asked to change them into decimals, fractions, and percents. They are asked to draw specific M&Ms at random for experimental probability problems. They are asked to make a few predictions, as well. This is a lengthy lesson and takes a while to get through, so make sure you have enough time to get through it. It can be done in 2 days, and if you need to use colored chips or counters instead, go for it!
Subjects:
Grades:
5th - 11th
Types:
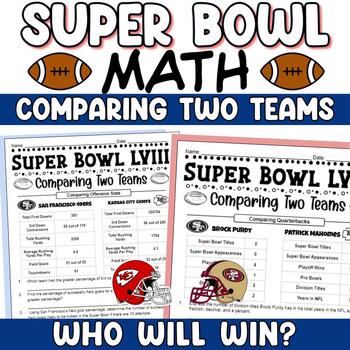
Super Bowl Math 2024 Comparing the Teams - Real NFL Super Bowl Stats
This Super Bowl LVIII Math activity is perfect for football lovers! It uses real-world statistics to compare the Kansas City Chiefs and San Francisco 49ers and asks students to form their opinion of the better team. Skills learned in early middle school are used to compare the quarterbacks, offensive stats, defensive stats and season records of San Francisco and Kansas City. Some of the skills assessed include measures of central tendency, decimals, fractions, percents, ratios, and proportions
Subjects:
Grades:
6th - 8th
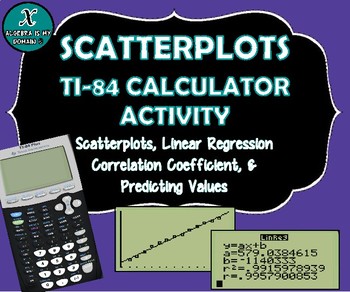
TI-84 CALCULATOR ACTIVITY - Data, Scatterplots, Regression & Line of Best Fit
This file includes four linear regression examples (all real-life data). The examples cover the following topics for the TI-84 graphing calculator:
* Creating a scatterplot
* Performing linear regression (finding the equation of the best-fit line)
* Interpreting the slope of the equation
* Calculating and interpreting the correlation coefficient
* Predicting values (using the linear regression equation)
The first example gives the step-by-step instructions to calculate all the necessary value
Subjects:
Grades:
7th - 12th, Higher Education
Types:
CCSS:
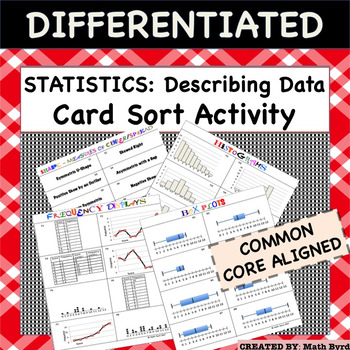
Statistics:Representing & Interpreting Data (Histogram, Box Plot, Dot Plot)
Complete Lesson! This lesson features a 40 CARD SORT, Differentiated Cornell Notes, Distribution Shapes Graphic Organizer, and Power Point to go with the notes! Perfect for the inclusive classroom! Within the Card Sort Activity there are 5 categories of cards to match: 1) Histogram2) Frequency Display (including Dot Plots, Frequency Line Graphs and Tables)3) Box Plots4) Describing Shape5) Describing Measures of Center & Spread. With 8 different sets of matches, there are 40 cards total. Stud
Subjects:
Grades:
8th - 12th
Types:
CCSS:
Also included in: Common Core Algebra 1 CARD SORT ACTIVITIES - BUNDLE PRICE!
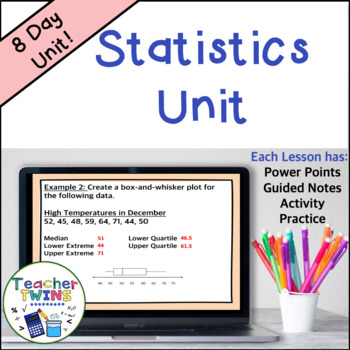
Statistics Unit - Mean Absolute Deviation - Populations and Samples - Box Plots
Make lesson planning easy with this no-prep Statistics - Mean Absolute Deviation - Populations and Samples - Box-and-Whisker Plots Unit! Included are 8 ready-made lessons to teach finding mean absolute deviation as well as interpreting and creating box-and-whisker plots. This unit is very easy to use and will save you a lot of time! Your students will learn how to find mean absolute deviation and interpret box-and-whisker plots by using our editable PowerPoints with guided notes. Students will l
Subjects:
Grades:
6th - 8th
Also included in: 7th Grade Math Curriculum Bundle
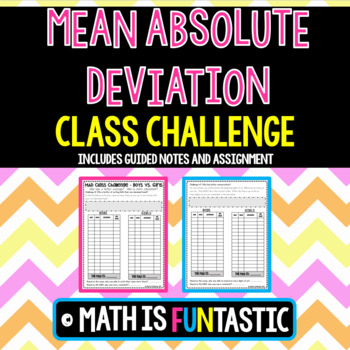
Mean Absolute Deviation - Class Challenge
Are you looking for an engaging way to teach Mean Absolute Deviation? Look no further! My students love completing this lesson.
This product is designed to help your students master the MAD in three easy steps.
1) Guided Notes – The guided notes contain an introduction to calculating MAD. Students will write the overall meaning of the MAD and the steps to calculating. There is an example problem for the teacher to model and then two “you try” problems for students to try independently a
Subjects:
Grades:
6th - 9th
Types:
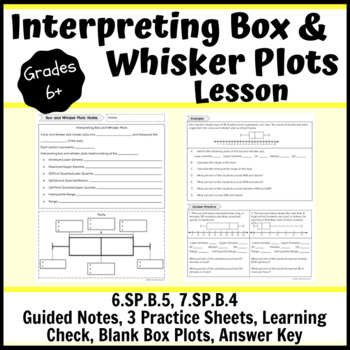
Interpreting Box and Whisker Plots Lesson- Notes, Practice, Learning Check
This interpreting box and whisker plots lesson consists of a guided notes sheet, 3 practice sheets, a learning check, 2 different half sheets of blank box plots and an answer key. You can hole punch the note pages and have students place them in their binders or a 3-prong folder. There are teacher notes to guide you through the direct instruction with students. There are three pages of practice. One page can be used as independent practice when students are ready; this could be in class or homew
Subjects:
Grades:
6th - 10th
Types:
Math Projects Middle School Bundle for STEAM
Jump into middle school math concepts with this Art meets math bundle of creative math projects. Great for math lab days or stations. 8 Math meets arts lessons + a bonus resource of linear equations with Calder ($45 VALUE). Each project includes:- Teacher's guidelines- Background information on artist- Student handouts for each part of the project- Answer key (where applicable)- Editable rubric (where applicable)- Slides or artwork related to projectThis bundle includes:- Rational vs. Irratio
Subjects:
Grades:
6th - 8th
Types:
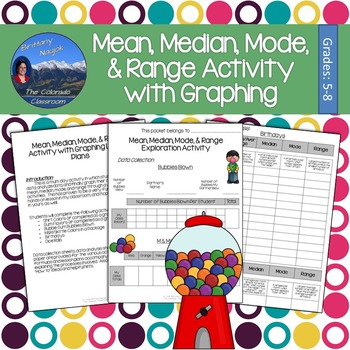
Mean Median Mode and Range Exploration Lab & Graphing Activity
Mean, median, mode, and range are explored in this activity lesson pack complete with lesson plans, student packets, and graphing pages. You and your students will tackle these four important measures of central tendency through a fun lab activity involving bubble gum, M&Ms, birthdays, dice, and more. Students will collect data, analyze their data, and then graph their results all while learning about the mean, median, mode, and range of various scenarios.This activity is prepared and read
Subjects:
Grades:
5th - 8th
Types:
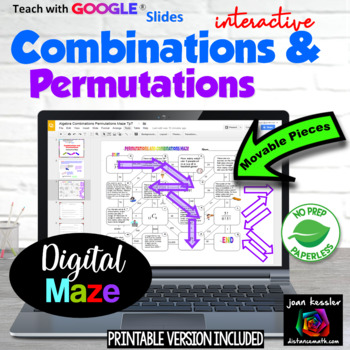
Permutations and Combinations Digital Maze + HW and Printable version
This Combinations, Permutations, and Counting Fun Maze is engaging, challenging, and fun for your students. This resource includes both a digital and printable version. This activity reinforces the concepts of permutations, combinations, and counting principles and is great practice. The different types of problems are placed randomly in the maze so that students must first decide the type of question before solving. The questions on the maze are letter coded so that if a student has a questi
Subjects:
Grades:
8th - 11th
Types:
CCSS:
Also included in: Algebra 2 Digital MEGA Bundle plus Printables
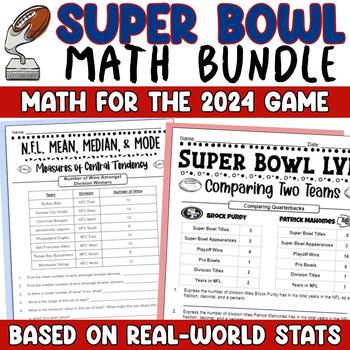
Super Bowl Math Activities Bundle 2023 - NFL Stats Math and Super Bowl Teams
These Super Bowl Math activities for 2023 are perfect to cheer on the Chiefs or the Eagles! Your football fans will love comparing the two teams to determine a winner, and finding the measures of central tendency for real NFL stats from the 2022 season.In Super Bowl Math: Comparing Two Teams, students pit the Eagles and Chiefs against one another to predict a winner. They analyze real-world statistics from this season, including offensive statistics, defensive stats, quarterback experience, an
Subjects:
Grades:
6th - 8th
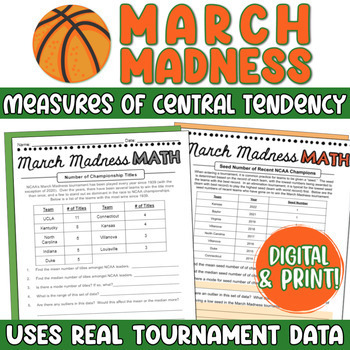
March Madness Math Mean, Median, Mode - Measures of Central Tendency Activity
This March Madness math activity asks students to determine mean, median, mode, and range for a variety of actual statistics from previous NCAA March Madness basketball tournaments. Perfect to excite any sports enthusiasts! It includes both print and digital formats, perfect for Google Classroom.Each page slide within the activity is dedicated to a different statistic (for example, years since previous championships amongst winners, regular season wins amongst Elite 8 teams, Seeds of Champions
Subjects:
Grades:
6th - 8th
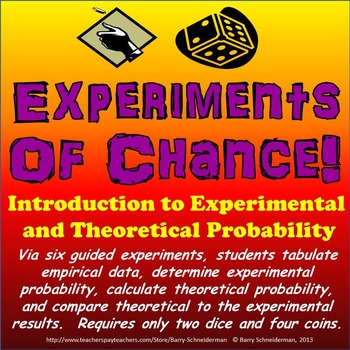
Experimental Probability and Theoretical Probability - Experiments of Chance!
Probability is so frequently used in every-day life, yet so often under-explored as a common core subject in math classrooms. This is the first in a series of products which bring probability to life in upper elementary and middle school classrooms. Experiments of Chance gives students an introduction to experimental and theoretical probability by providing:- A warm-up problem via which the students review necessary prior knowledge and begin to think about the different components of probabili
Subjects:
Grades:
5th - 8th
Types:
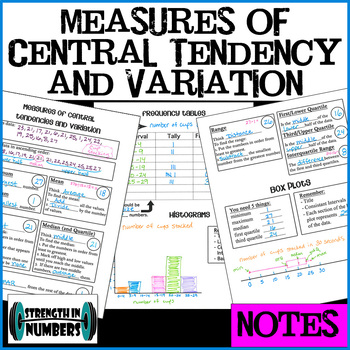
Interactive Notebook NOTES: Mean Median Mode Range Quartiles Box Plot Histogram
This set contains suggestions for student data collection and notes that use the data for measures of central tendencies and variation (mean, median, mode, range, first and third, quartiles, interquartile range, outliers), box plots, frequency tables, and histograms! Sounds like so much but these topics all go together so well. And by using data collected by students ABOUT students, they will be much more interested. This product contains ideas for collecting data, three full size (8.5x11) pa
Subjects:
Grades:
6th - 9th
Also included in: Complete BUNDLE of 50 Foldable Notes for Math 7

Box and Whisker Plot PPT and Guided Notes 6.SP.2 , 6.SP.4 , 6.SP.5
Box and Whisker Plot
This PPT lesson teaches students the vocabulary that goes with box and whisker plots as well as the steps for creating a box and whisker plot.
Along with the PPT are guided notes where students can answer questions while watching the PPT as well as the answer key. They also have the chance to create their own box and whisker plot. This is a great introductory lesson. This matches Common Core Standards for 6th grade, but could be adapted and used for other grades as we
Subjects:
Grades:
5th - 8th
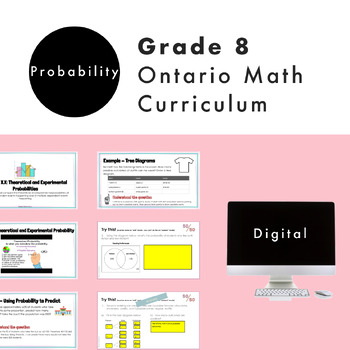
Grade 8 Ontario Math Probability Digital Google Slides + Form
Do you need a practical and engaging resource for the NEW Ontario Math Number strand? Are you planning for the NEW Grade 8 Ontario Math Curriculum? This editable Google Slide resource is what you need! This resource is for the Grade 8 DATA strand and covers specific expectations for “D2 Probability". In this resource, students will experience math through engaging real-life questions, storytelling through math, and interactive slides. What’s Included2 Google Slide presentations67 UNIQUE and ED
Subjects:
Grades:
7th - 9th
Types:
Also included in: Grade 8 NEW Ontario Math Curriculum Full Year Digital Slides Bundle
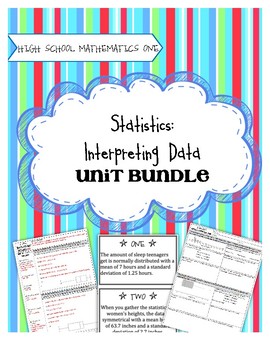
High School Math 1: Statistics and Interpreting Data
Task-Based Learning gets students intrinsically motivated to learn math! No longer do you need to do a song and dance to get kids interested and excited about learning. The tasks included in this unit, followed by solidifying notes and practice activities, will guarantee that students understand the concepts. This unit covers:
- Displaying one-variable data in a histogram, dot plot, or box plot
- Describing the distribution of data using statistical vocabulary
- Using data models and stati
Subjects:
Grades:
8th - 10th
Types:
CCSS:
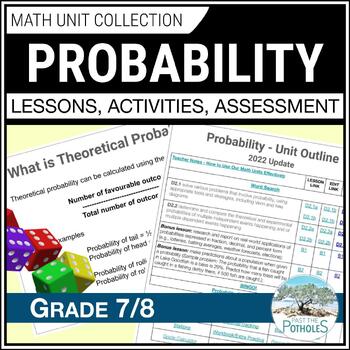
Theoretical and Experimental Probability Activities Grade 7/8 Ontario Math Unit
SAVE YOUR VALUABLE TIME! Ontario math teachers love our UPDATED Probability units! Lesson plans, centres, activities, worksheets, and assessments cover theoretical probability, experimental probability, tree diagrams and more.Our units encourage students to use and develop their Knowledge, Application, Thinking, and Communication skills in a way that will prepare them for success in the future."I have used many of the Ontario Math resources created by Past The Potholes and love them all. The Go
Subjects:
Grades:
7th - 8th
Types:
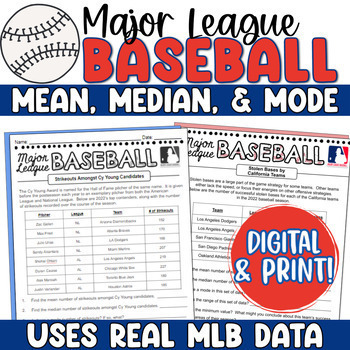
Baseball Math Mean, Median, Mode - MLB Baseball Measures of Central Tendency
This real-world baseball math statistics project asks students to determine mean, median, mode, and range for a variety of actual statistics from the 2023 Major League Baseball season. Perfect to excite any sports enthusiasts! It includes both a traditional print option and a digital version, made for Google for any 1:1 classrooms!Each slide within the activity is dedicated to a different statistic (for example, strikeouts amongst Cy Young candidates, or homeruns amongst MVP candidates). Stud
Subjects:
Grades:
6th - 9th
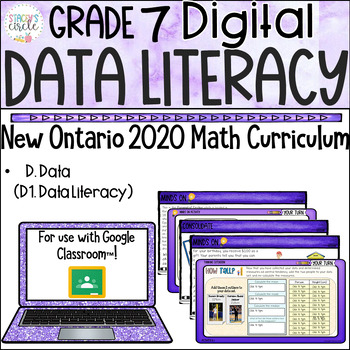
Grade 7 Data Literacy NEW Ontario Math Digital Google Slides : D . Data
This comprehensive digital Ontario Math resource covers EVERY single specific expectation from the D1. Data Literacy strand in the NEW Grade 7 2020 Ontario Math Curriculum-- See below for specific expectations. Grade 7 Teachers, you're going to want this in your collection! WHY BUY THIS PRODUCT OVER OTHERS?My vision for teaching math is always "Don't just tell the story, let the students experience the story first hand". HOW?Students will be walked through curriculum concepts step-by-step in eas
Subjects:
Grades:
6th - 8th
Types:
Bundle G8 Bivariate Data / Scatterplots - NBA Numbers Performance Task
Bundle of 29 editions of NBA Numbers Performance Task for 8th grade
In the NBA Numbers Performance Task, students use real data on the players in their favorite basketball team to practice interpreting a scatter plot and finding the equation for the line of best fit, and to extend into constructing a scatter plot from a set of data in an engaging, real world context. Students take on the role of a statistical analyst for the team and determine which player statistics are related to help make im
Subjects:
Grades:
8th
Types:
Bill Nye the Science Guy : PROBABILITY (STEM / math video worksheet / sub)
*Video is needed for completion of this product*Please make sure you have access to the video prior to making your purchaseWant more BILL! BILL!! BILL!!! – CLICK HERE!*This worksheet can be used to accompany the Bill Nye video PROBABILITY (Season 4, Episode 8).The worksheet has a series of questions that help students stay focused on various science facts about PROBABILITY. Areas covered: percentages, how probability is used in the world, math-science facts, and simple hands-on games and activit
Subjects:
Grades:
5th - 8th
Types:
Statistics Math Article - Case Studies of Bad Graphs found in the Media
Incorporate Reading & Writing into the Math Classroom with this article and accompanying worksheet! The 4 page article is entitled - "How the Media Uses Statistics to Mislead Audiences: Real- life examples of really bad graphs". The worksheet helps students summarize the case studies and the article as a whole. This resource can be used in so many ways, some ideas are: station activity, independent reading assignment, small group activity, homework assignment, or whole class discussion.Skill
Subjects:
Grades:
8th - 11th
CCSS:
Also included in: Common Core Algebra 1 MATH READING ARTICLES - BUNDLE PRICE!
Food Waste and Mathematics: From Farm to Table to Dump
Here's a very uncomfortable fact: it takes 4 pounds of potatoes to make 1 pound of potato chips. That means that for every 1 pound bag of potato chips you eat, 3 pounds of potatoes have to be thrown away. What a waste of food! This is a series of activities that looks at the hidden world of food waste. It includes a look at how much food is wasted as it is "processed" into finished products like french fries and potato chips. It also includes mathematical activities where students calculate how
Subjects:
Grades:
5th - 12th, Adult Education
Types:
Showing 1-24 of 911 results


