127 results
7th grade algebra laboratories
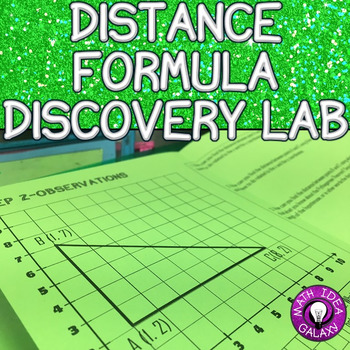
Distance Formula Lesson (Discovery Lab)
This is a discovery activity that will guide your students to deriving the distance formula using the Pythagorean Theorem. This is a partner activity that is an introduction before you give notes.
This resource includes:
-Background Building Activity
-A Discovery Activity
-Reflection
Grades:
7th - 10th
Types:
CCSS:
Also included in: Pythagorean Theorem Activities
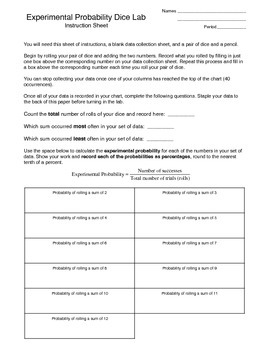
Experimental Probability Activity (dice lab)
In this activity students work with a partner to roll a pair of dice (many times) and record the sum of the dice in a data collection sheet. Once the data has been collected the students are walked through the process of calculating the experimental probability for each sum and then the theoretical probability for each sum and are asked questions about the differences they find between the values. Students also make a bar graph using the percentages for theoretical probability and can visually s
Subjects:
Grades:
7th - 11th
Types:
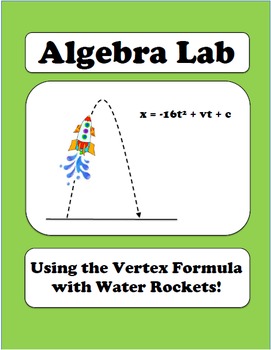
Algebra Lab: Quadratics - Using the Vertex Formula with Water Rockets!
Are you the type of teacher who will go that extra mile to get your students involved. Then have I got a lab for you! Build and launch water rockets to help your students connect with quadratics and the vertex formula.
With just a few simple and inexpensive PVC parts from the local home improvement store, and a bicycle pump, you can build yourself a simple and fun water bottle rocket launcher. And the rockets are simple 2-liter soda bottles, but boy do they fly!
See my students launching wa
Subjects:
Grades:
7th - 10th
Types:
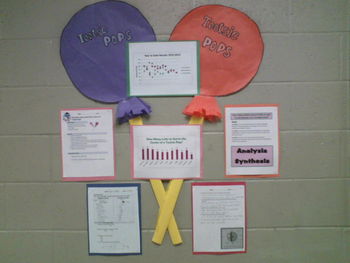
How Many Licks to the Center of a Tootsie Pop? Statistics!
Looking for novel way to get your middle school students excited about math and statistics?!
This file contains everything you need to conduct the experiment (except the Tootsie Pops!) that answers the age old question "How many licks does it take to get the center of a tootsie pop?" The lesson covers mean, median, mode, range, outliers, tables, graphs, box and whisker plots, data collection, pre and post discussion questions, experimental procedures, and student reflection. I also provided a s
Subjects:
Grades:
6th - 9th
Types:
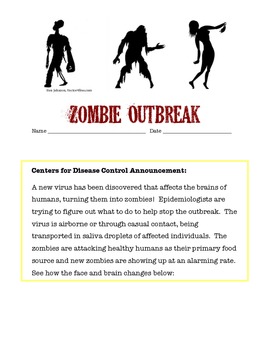
Investigating the Spread of a Viral Outbreak
Students in grades 5 - 9 model the spread of an infectious disease under the entertaining theme of a zombie outbreak. One student unknowingly is patient zero and students simulate the spread of an airborne illness. This highly engaging activity covers health topics, nature of science, and math skills as students graph data in a line plot. Higher level students can be challenged to find the function of the exponential growth of the outbreak.
Subjects:
Grades:
6th - 9th
Flip Book Transformation Project
Students create a flip book using Power Point to discover and/or apply properties of geometric transformations. The student handout provides detailed instructions on how to create the flip book which includes using the “duplicate slide” feature in Power Point. Students are required* to create a minimum of 10 slides with 4 different movements. Students are given the opportunity to choose what type of movements they use within given parameters. This choice provides the opportunity for great di
Grades:
7th - 10th
Types:
Also included in: Transformations Bundle
Math Lab: Terminating and Repeating Decimals/DISTANCE LEARNING/NO PREP
This is a GREAT lab for students to discover the value of patterns in our wonderful world of mathematics! * In the lesson, students DO discover a relationship between fractions and decimals beginning with NINETEEN FRACTIONS THAT STUDENTS ARE REQUIRED TO DIVIDE THE NUMERATOR BY THE DENOMINATOR ON EACH.* Students learn the meaning of the terms "terminating" and "repeating" relative to decimals.* Students learn how and when it is appropriate to use the bar above repeating decimals. *
Grades:
6th - 10th, Higher Education, Adult Education
Types:
Scatterplots Linear Regression Line of Best Fit Forearms & Height (Editable)
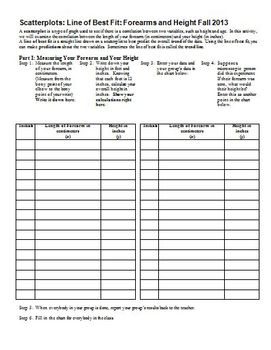
After teaching my students about scatterplots, correlation, and the line of best fit, I take a day for them to do a hands-on lab, in which they measure their height (in inches) and their forearm length (from the tip of their elbow, to the bony point on their wrist), and we plot the class data, write the equation of the line of best fit, and then use the equation generated both forwards and backwards. They will need 45 minutes to an hour to do this in class.
I have found that if the students br
Subjects:
Grades:
7th - 12th
Types:
Ms. Burrows' Human Body Proportion Lab Parts 1 and 2
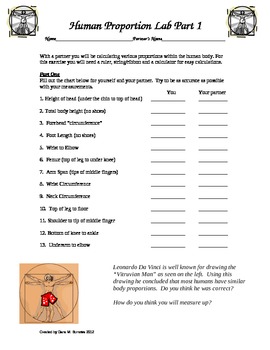
A full description of this lab is free to download on TCP under my other listings. This is printable lab worksheet for students to use for the Human Body Proportions Lab.
This is an EXCELLENT lesson that both you and your students will enjoy.
Ms. Burrows Body Proportions Lab by Dana M. Burrows is licensed under a Creative Commons Attribution 3.0 Unported License.
Subjects:
Grades:
6th - 10th
Types:
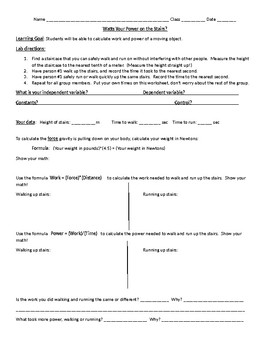
"Watts Your Power on the Stairs?" Quick lab calculating work and power
This lab activity has students compare the work and power they have while walking and running up a flight of stairs. This is a pretty common lab activity, but I just could not find a student handout that had exactly what I was looking for. So, I made this one and hope you will try it out and let me know how it goes!
Students will have to measure the distance and time of each trial, and use the work and power formulas. They will also identify the independent variable, dependent variable, cons
Subjects:
Grades:
6th - 12th
Types:
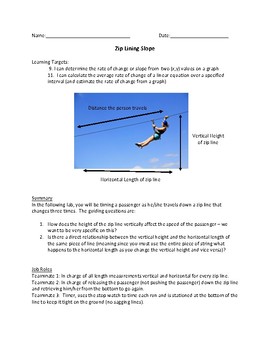
Zip Lining Slope Between to Points Lab Activity
Goal: understand slope conceptually and calculate slope through any two points.
How do you plan to make the ratio of rise to run hands on and visual for students? How about by asking them to create zip lines? In this activity students will work in teams to create fast and slow zip lines using fishing line, paper clips, and any toy you can hang from the clip. Students will experiment with the ratio of rise to run as they must use the entire piece of wire for every zip line run meaning the onl
Subjects:
Grades:
7th - 10th
Types:

Quadratic Functions - Introduction to graphing with Technology
I introduce my students to graphing quadratic functions using technology with this self made worksheet. My students like spending time in the computer lab, it gives them independence to try something new and they enjoy seeing the graphs be formed on the screen as soon as they type in an equation and they love getting out of the classroom! It is a lot more fun then graphing with paper and pencil.
I consider this work as a project because it is work done outside a classroom. It requires a com
Subjects:
Grades:
7th - 11th
Types:
CCSS:
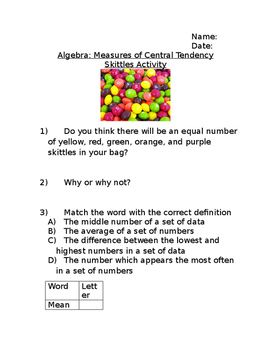
Algebra: Measures of Central Tendency Skittles Activity
Fun way for students to practice using measures of central tendency: Mean, Median, Mode, and Range. Activity also reviews percentages. Students have so much fun working, collaborating, drawing, and of course love eating skittles!
Grades:
6th - 9th
Types:

Webquest Investigation - Slope of a Line
Using a free online graphing calculator, students explore relationships between linear equations, their graphs, and the slopes of the lines. By the end of this investigation, students will discover relationships between parallel lines, perpendicular lines, and their slopes. Enjoy!
Subjects:
Grades:
7th - 11th, Adult Education
Types:
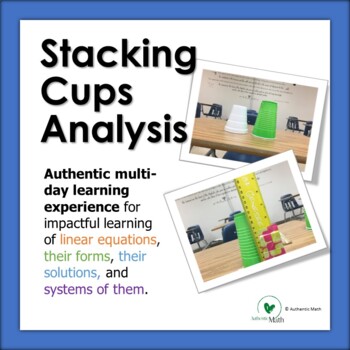
Stacking Cups Analysis - an authentic in-depth discovery of linear equations!
Starting with a simple question, your class will embark on a three-to-five-day authentic learning experience that will allow your students to develop an intuitive understanding of rate of change, initial value, forms of linear equations, systems of linear equations, and their solutions! Ready?This is a three-part learning experience.In Stacking Cups students independently* try to answer the question "How many cups does it take to make a stack as tall as your teacher?" by taking measurements and
Subjects:
Grades:
7th - 10th
Types:

Similarity: A Clip Art Investigation
In this inquiry activity, students will use clip art to discover the properties of similar figures (corresponding sides proportional and corresponding angles equal). Have students pick out a clip art that represents them. It is preferable to choose clip art that has some straight lines and definite angles to measure. (For example, a baseball would not be easy to gather the necessary data, but a baseball bat or baseball player would be suitable.) Students should then make the clip art 2 dist
Grades:
7th - 10th
Types:
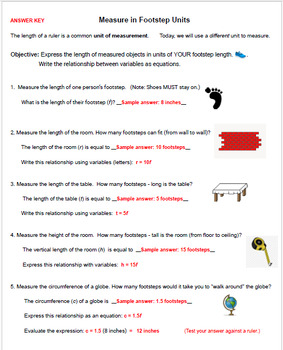
Activity: Measuring in Units of My Foot - Writing Simple Equations
In this activity, students use measuring skills & write one-step equations. An answer key is provided. Students measure the length of their foot (in inches) and use it as a base unit for expressing the length of different objects. Students use the variable "f" and a coefficient (number of footsteps) to write a simple equation for the length of an object. You can add the challenge of having students evaluate the expression. This measuring activity can be used in a math or numeracy class, as w
Subjects:
Grades:
4th - 12th, Higher Education, Adult Education, Staff
Types:
LEGO Robotics Introduction
Here's a 10-15 day set of activities for introducing the LEGO Mindstorms Robots! In this packet, you get:* SEVEN Robot activities!* An EXCEL Activity creating a multiple line graph.* Programming challenges from basic to hard.* Build Guide for "Reece's Runner" Robot* Robot Challenge Design PlansI use this as a 10-day Module in my classroom.
Grades:
5th - 8th
Types:
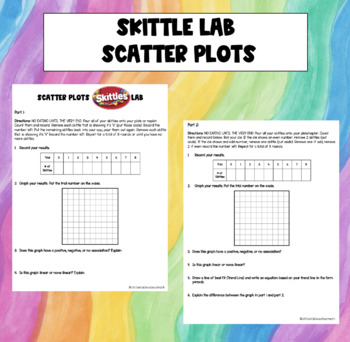
Skittles Lab - Scatter Plots
In this lab, students will be creating data that they can use to create scatter plots and either demonstrate their understanding of scatter plots or discover new learning about scatterplots. Students will be creating two different scatter plots based on their skittles in their cup. They will follow directions and plot the data they create. The first part has students analyzing the trend of their data (positive, negative, no association) and describing the shape of the data. The second part of t
Subjects:
Grades:
7th - 9th
Types:

SPECIAL FX - A DESIGN BRIEF
This challenge presents an opportunity for students to design and conduct a fair test investigation, to gather accurate data about the physical abilities of a living organism and to make reasonable interpretations of collected data. In addition, the students will also be expected to correctly apply the formula for computing speed and to develop a method for comparing the speed of the organism to that of a human.
Grades:
7th - 10th
Types:
CCSS:
NGSS:
MS-ETS1-1
, MS-ETS1-3
Also included in: FORCE AND MOTION DESIGN BRIEFS

GONE WITH THE WIND - A DESIGN BRIEF
This challenge is one of several associated with wheeled vehicles and the variables that affect vehicle performance. It would be to the students’ advantage if they had some prior construction experience with other projects, preferably with other wheeled vehicles. These other vehicles could have been powered by rubber bands, electricity, solar energy, air pressure, tension springs or gravity. This challenge expects the vehicle to be wind powered.
Subjects:
Grades:
7th - 11th
Types:
CCSS:
NGSS:
MS-ETS1-4
, HS-PS2-2
, MS-PS2-2
, HS-PS2-1
, MS-ETS1-1
...
Also included in: FORCE AND MOTION DESIGN BRIEFS
HUMPTY DUMPTY - A DESIGN BRIEF
This design brief was developed to be used as a real-life application of Newton’s first law of motion. This design brief also could be classified as a general design challenge. In addition to the foregoing, this challenge could be used as an opportunity for students to research the design of actual automobile restraint devices.
Subjects:
Grades:
7th - 10th
Types:
CCSS:
NGSS:
HS-ETS1-2
, MS-ETS1-4
, MS-ETS1-1
Also included in: FORCE AND MOTION DESIGN BRIEFS
ROLL A RAMA - A DESIGN BRIEF
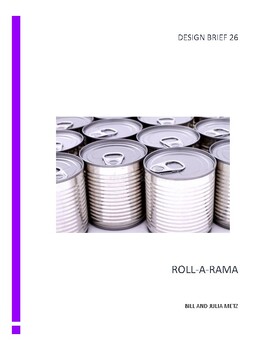
This design brief could be used as a general design challenge or as a discrepant event for introducing the concept of inertia and Newton’s laws. In any case, students will need to explore the rolling characteristics of each of the cans of soup as well as the other variables that affect their relative speeds. Given the mathematics background of the students, the formula V =d/t could be used to compute the speed of each can (V = velocity, d = distance and t = time).
Subjects:
Grades:
7th - 11th
Types:
NGSS:
HS-ETS1-2
, MS-PS2-4
, MS-ETS1-4
, MS-PS2-2
, MS-ETS1-1
...
Also included in: FORCE AND MOTION DESIGN BRIEFS
GRAVITY: how much would you weigh
This is a nice little activity for helping your students get to understand how gravity works. In this activity students will be required to calculate how much they weigh on other planets in our solar system. Once they know how much they would weigh, they are required to create a bar graph showing how much they weigh on each planet in graphical form.
This covers common core standard #7, integration of knowledge and ideas.
Subjects:
Grades:
5th - 12th
Types:
Showing 1-24 of 127 results


