116 results
4th grade statistics classroom decors
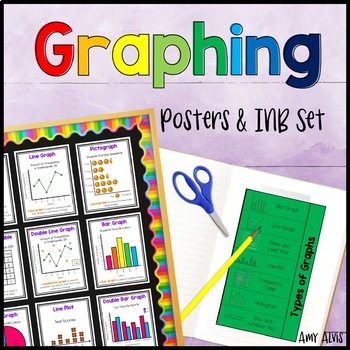
Graphing Posters & Interactive Notebook Bar Graph Picture Graph Line Plot
This poster or anchor chart and interactive notebook (INB) set includes FOURTEEN posters covering bar graphs, double bar graph, pictographs, picture graph, line graphs, double line graph, line plot, circle graphs, frequency tables, sector graph, stem and leaf plots, histograms, dot plots, parts of a graph and box and whisker plots. This set also includes SIX different foldable interactive notebook (INB) pages (that you print and put into a paper notebook) for students to take notes as well as a
Subjects:
Grades:
2nd - 5th
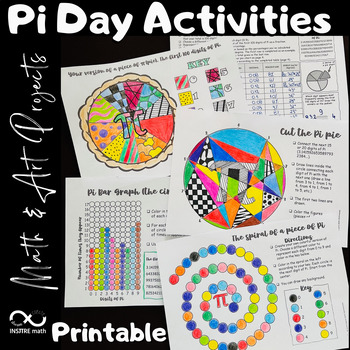
4 Pi Day Math Activities | Math & Art Projects | Coloring Circles | Pie Chart
4 Math & Art Projects to celebrate Pi Day that include circles and Pi exploration! Your students will love these Pi Day activities! Let your students express themselves using these hands-on Math & Art resources during the exploration of Pi.Content:- Your version of a piece of π (pie). The first 100 digits of Pi. Frequency Pie Chart.- Pi Bar Graph - the circular version.- The spiral of a piece of Pi.- Cut the Pi pie.This resource includes:- The editable PowerPoint™ version.- The printable
Subjects:
Grades:
4th - 8th
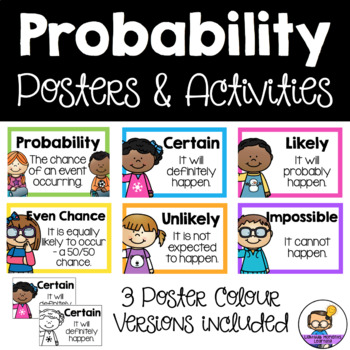
Probability Activities & Posters
It would be IMPOSSIBLE for you not to love these probability posters and activities! I am CERTAIN that these activities will be a fun addition to your classroom and provide a fun way to teach your students about probability.
This resource covers the terms Certain, Likely, Even Chance/Equally Likely, Unlikely and Impossible.
Posters included:
• Probability
• Certain
• Likely
• Even Chance (Equally Likely option included)
• Unlikely
• Impossible
Note: 3 colour versions included
Activities:
Subjects:
Grades:
1st - 4th
Types:
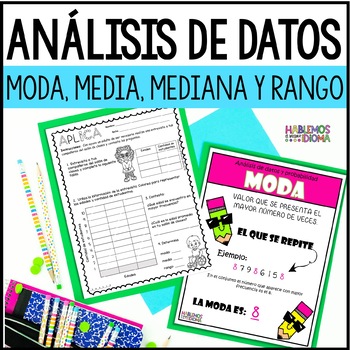
Análisis de datos moda, media, mediana y rango | Interpretación gráficas
¿Necesitas actividades para trabajar con tus estudiantes de grados primarios el análisis de datos (moda, media, mediana y rango) e interpretación de gráficas de una forma sencilla y divertida? Este recurso incluye carteles, hojas de trabajo, plegables para libreta interactiva y más.El siguiente recurso se llevó a cabo con la intención de ofrecer acceso curricular a la destreza de una forma sencilla y atractiva para el estudiante. El recurso se desarrolló para un aula inclusiva está dirigido a
Subjects:
Grades:
4th - 8th
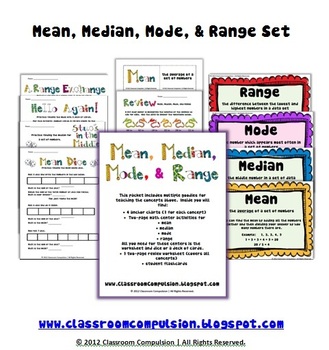
Mean Median Mode Range Pack (Math Centers, Flashcards, Anchor Charts)
This pack has everything you need to supplement your Mean, Median, Mode, and Range instruction! It includes 4 colorful anchor charts (1 for each concept)for you to display around the room, 4 two-page math centers that only require dice or a deck of cards (1 for each concept), a fun set of flashcards for your students, and a two-page review worksheet that covers all the concepts. The preview photos do not show all the pages.
Subjects:
Grades:
3rd - 6th
CCSS:
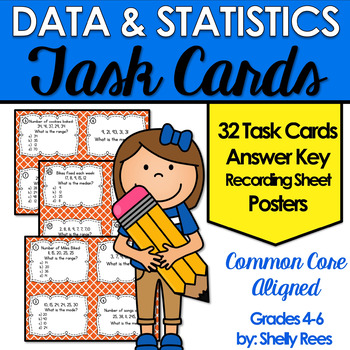
Mean, Median, Mode, Range Task Card and Poster Set - Data and Statistics
Mean, Median, Mode, Range, Data and Statistics is easier for students to master with this easy-to-use set of task cards and posters! Students will love the variety of practice with this task card set, and teachers will enjoy the little prep with big results!
Click here and SAVE by buying the Complete Bundle of Math Task Cards for Grades 4-6.
This helpful Data and Statistics Task Card Set includes:
• 32 Task Cards (28 on-level and 4 challenge)
• 5 Example and Teaching Posters
• 2 Standard Pos
Subjects:
Grades:
4th - 7th
Types:
CCSS:
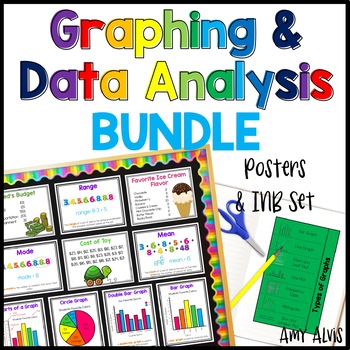
Graphing and Data Analysis Bundle Posters Interactive Notebook INB Anchor Chart
This bundle includes my Graphing Poster and Interactive Notebook (INB) set, my Data Analysis Poster and Interactive Notebook (INB) set and my Data Posters and Cards. Make sure to check the links below to see what comes with each set.This bundle includes:1. My best selling Graphing - Poster and INB Set.This poster and interactive notebook (INB) set includes FOURTEEN posters covering bar graphs, double bar graph, pictographs, picture graph, line graphs, double line graph, line plot, circle graphs
Subjects:
Grades:
2nd - 6th

How Much is Your Name Worth? Find the Mean, Median Mode of Your Name!
Looking for an engaging way to teach and review mean, median, mode and range? This activity is not only fun and challenging BUT it is PERFECT for bulletin boards.
Included in this set:
-Slides 3-6 are a review or teaching tool to reinforce how to find solve for each: Mean, Median, Mode and Range.
* (Brain Pop has a great video for this!)
-Slide 7 is the key for finding out the value of their first and last name
-Slide 8 is where they figure out and record how much their name is worth
- Sli
Subjects:
Grades:
3rd - 5th
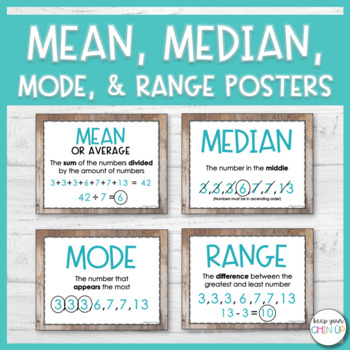
Mean, Median, Mode, and Range Posters
Looking for a visual to help your students with determining the mean, median, mode, and range of a data set? These simple posters are designed to help your students remember key words and formulas for each of the terms.
WHAT'S INCLUDED?
► 2 Options for printing (color or black & white)
► Posters for the terms: mean, median, mode, range, and data set
► Vocabulary worksheet
► Practice worksheet
Subjects:
Grades:
4th - 6th
Types:
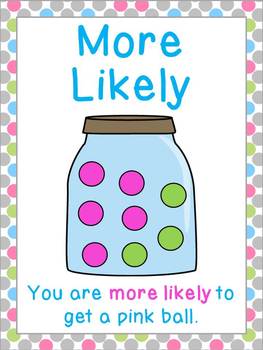
Probability Vocabulary Posters
Probability vocabulary posters: 10 cute probability posters to help students visually understand probability vocabulary terms certain, likely, unlikely, equally likely, more likely, less likely, impossible, possible, very likely, and very unlikely.
These can be used to teach probability since each poster has a comprehensible visual. They are great classroom posters to hang up for students to reference.
These are included in the super jam-packed Probability MEGA Pack which I highly recommend f
Subjects:
Grades:
K - 5th
Types:
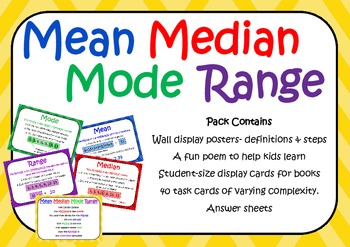
40 Mean Median Mode & Range Task Cards (> 80 questions), Posters & More
This pack is designed to give students a thorough understanding of mean, median, mode and range. It includes a fun poem (to the tune of Hey Diddle Diddle) to give students a way of always remembering how to calculate the mean, median, mode or range of any data set, as well as 40 task cards of varying complexity, wall reference posters and reference cards for student’s books.The yellow task cards (1-20) are the easier ones and the orange (21-40), the more complex. The cards can be used in centers
Subjects:
Grades:
4th - 8th
Types:
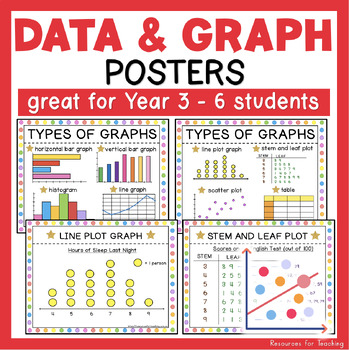
Types of Graphs Maths Posters for Year 3, 4, 5 & 6 Students
These vivid types of graphs maths posters are perfect for Year 3, 4, 5 & 6 students learning to collect, interpret and organise data in math lessons. All these posters are fantastic for using during a class discussion to differentiate between different graphs by looking at the physical characteristics and then interpreting the information. The Posters Include:1) Types of Graphs: horizontal bar graph, vertical bar graph, histogram, line graph, line plot graph, stem and leaf plot, scatter plot
Subjects:
Grades:
3rd - 6th
Types:
Probability Notes and Anchor Chart
The first page is an anchor chart of probability using fractions and words: impossible, unlikely, equally likely, likely and certain. The second page is a fill in the blank that the students can fill out as you teach the vocabulary words and concepts.
Subjects:
Grades:
3rd - 4th
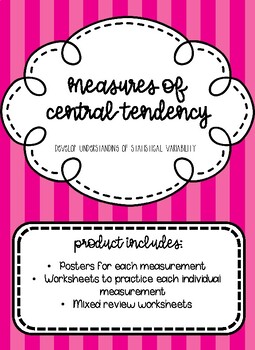
Finding Mean, Median, Mode, and Range
Simple worksheets (5 problems each) to introduce and practice finding the mean, median, mode, and range of a data set. Have students complete with or without calculator, depending on their instructional level. Product includes:-Reference posters for mean, median, mode, and range. Each poster includes the measures' definitions and directions for how to find them with an example.-5 worksheets about finding the mean.-5 worksheets about finding the median.-5 worksheets about finding the mode.-5 work
Subjects:
Grades:
1st - 12th
Types:
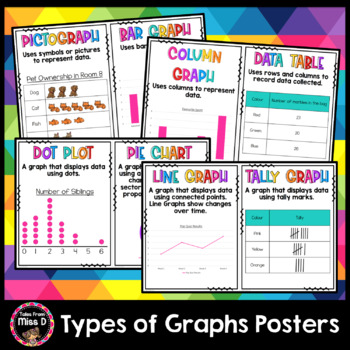
Types of Graphs Posters
Use these Types of Graphs posters for a class display to remind students about the different types of graphs. There are 7 different posters;PictographBar Graph/Column GraphData TableDot PlotPie ChartLine GraphTally GraphAustralian and American spelling is catered for.Have a question? Use the Product Q & A or email me at talesfrommissd@gmail.comFind Related Products HereMath Operations Posters, Times Table Posters, Math Vocabulary Posters, Missing Addends Posters, Preposition Posters, Ordinal
Subjects:
Grades:
3rd - 6th
Types:
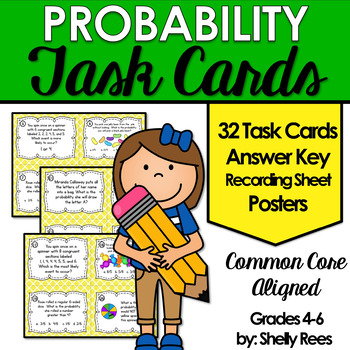
Probability Task Cards and Poster Set - Probability Activities
Probability can easily be practiced, reinforced, and mastered with this set of easy-to-use posters and practice task cards! Your students will love the variety of questions on the task cards and you will be happy with the ease of practice of probability concepts!
Click here and SAVE by buying the Complete Bundle of Math Task Cards for Grades 4-6.
This helpful set of helpful Probability Task Cards and Posters includes:
• 32 Task Cards (28 on-level and 4 challenge)
• 3 Example Posters
• Standa
Subjects:
Grades:
3rd - 6th
Types:
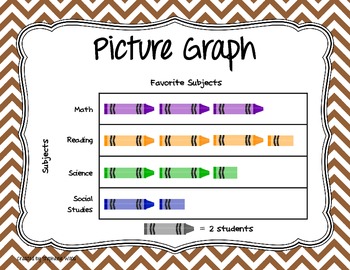
Types of Graphs Posters
Posters showing the various types of graphs for data display.
Includes:
Line Plot/Dot Plot
Line Graph
Bar Graph (Horizontal and Vertical)
Stem & Leaf Plot
Histogram
Box & Whisker Plot/Box Plot
Frequency Table
Circle Graph
Pictograph
Subjects:
Grades:
K - 12th, Higher Education, Adult Education
Types:
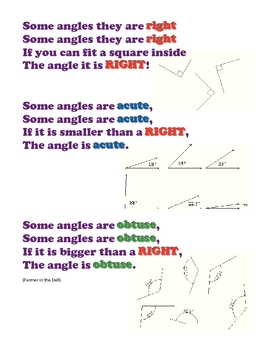
Math Chants-Vocabulary, Geometry, Odd/Even, Statistics, Number Lines
Eight different math chants: Odd & Even, Angles, Parallel Lines, Polygons, Number Lines, Median/Mode/Range, Edges/Faces/Vertices, Improper Fractions & Mixed Numbers
All sung to familiar tunes which are listed on the bottom of each page. GREAT fun in the classroom!!
Subjects:
Grades:
3rd - 5th
Types:
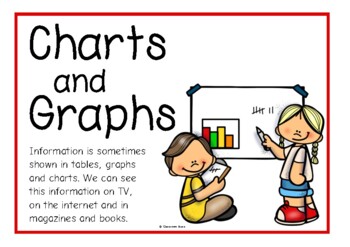
Charts and Graphs Information Poster Set/Anchor Charts
A set of 13 printables about charts and graphs and how statistics/data is interpreted. Includes: a title page, what are charts and graphs?, interpreting data, tables, tally marks, frequency tables, pictograms, block graphs, bar graphs, pie charts, line graphs, Venn diagrams and Carroll diagrams.Buy this resource in a Bundle and SAVE OVER 20%**Charts & Graphs Bundle Pack**You might also like our resources on: Drawing a Bar ChartProbabilityProbability StatementsAveragesTreetop Displays - print
Subjects:
Grades:
2nd - 5th
Types:
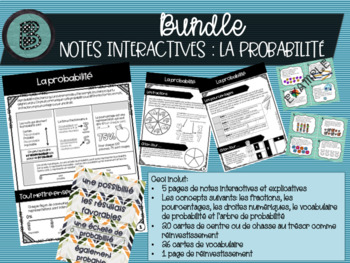
BUNDLE probabilité: notes interactives, cartes et vocabulaire
Voici 5 pages de notes interactives pour bien expliquer la probabilité en employant plusieurs concepts: les fractions, droite numérique, pourcentage, vocabulaire à l'étude et un arbre de probabilité. Ces notes permettent aux élèves d'étudier les concepts, ainsi que comprendre visuellement comment ils sont entre reliés. À la fin, il y a une feuille de réinvestissement. Ceci inclut mes cartes de probabilité qui pourraient être utilisé comme centre, ou activité de classe. Il y a 20 questions en tou
Subjects:
Grades:
4th - 7th
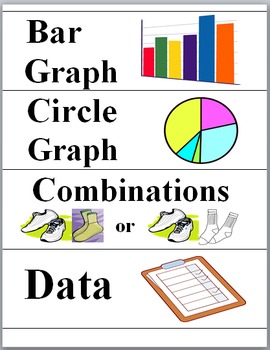
Statistics, Probability, Data and Graphs Illustrated Math Word Wall
The vocabulary and concepts included are sets, data, mean, medium, minimum, mode, range, survey, tally, charts, diagrams, graphs, key, probability, combinations, and tree diagrams.
This is an updated file.
Each of the 42 cards has a colorful illustration.
These cards can also be used as flashcards, Bingo Calling Cards, etc.
These Math Word Wall cards could be printed on card stock or photo paper and laminated, if desired.
*********************************************************************
Subjects:
Grades:
2nd - 6th
Also included in: Math Word Wall Bundle Grades 3, 4, 5
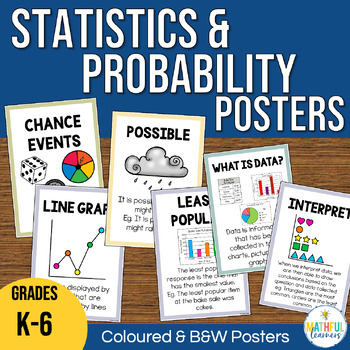
Statistics and Probability Posters - Teaching Math Terminology Vocabulary
This Statistics and Probability Math Vocabulary Set includes posters to support your students in learning about terms used in Data, Statistics, Chance and Probability units. Including over 200 pages of math terminology and definitions in an easy to read format, including pictures! Perfect as a colourful display or use directly onto your smartboard (IWB) for discussion points. Each poster is duplicated 3 times, full colour, colour and B&W.*** SAVE 30% by purchasing this Bundle of posters ***_
Subjects:
Grades:
2nd - 6th
Types:
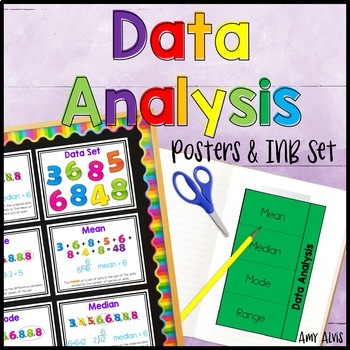
Data Analysis Posters and Graphic Organizer INB Set Anchor Chart
This poster and interactive notebook (INB) set covers data set, mean, median, mode and range. This set includes a ONE interactive foldable graphic organizer (INB), FIVE posters (8.5 X 11) and THREE versions of the data set cards.The posters and data cards come in a color version as well as a black and white version.Thank you for looking,Amy Alvis
Subjects:
Grades:
4th - 6th
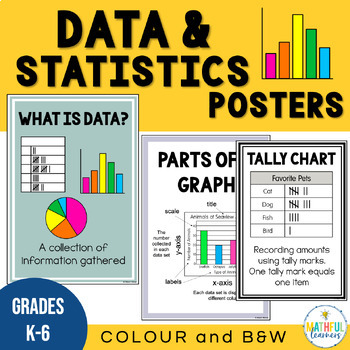
Data and Statistics Terminology Posters - Math Vocabulary Classroom Display
This Data and Statistics Math Vocabulary Classroom Display includes posters to support your students with their learning of Data and Statistics Terminology including definitions for types of graphs, interpreting graphs, as well as mode, mean and median. This resource includes 39 pages of definitions for data and statistics terms in an easy to read format, including pictures! Your students will be collecting, displaying, anaylsing and interpreting data like a pro in no time! Perfect as a colourfu
Subjects:
Grades:
K - 6th
Types:
Showing 1-24 of 116 results


