90 results
7th grade graphing workbooks
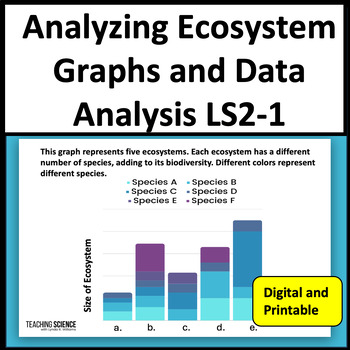
Analyzing Ecosystem Graphs & Data Analysis Resource Availability MS LS2-1
Do your students need practice with analyzing ecosystem graphs? These science graph worksheets include data analysis on resource availability in ecosystems. Students will use critical thinking to answer the questions. Great for Science TEST Prep! This set includes 20 pages of science graphs and diagrams with questions. You will get a printable PDF with a link to Google Slides. Great for CAST and STAR Test Prep.This Ecosystem Graph Practice Unit Includes:•20 printable pages of charts and diagrams
Subjects:
Grades:
6th - 8th
Types:
NGSS:
MS-LS2-1
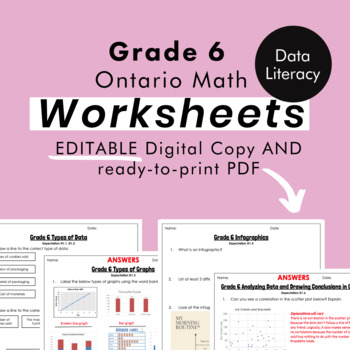
Grade 6 Ontario Math -Data Literacy Worksheets -PDF+FULLY Editable Google Slides
Are you looking for practical and easy to use supplement practice for the NEW Grade 6 Ontario Math Curriculum? These ready-to-print PDF and EDITABLE worksheets is exactly what you need! Note this resource compliments my digital Data Literacy unit, but can also be used separately! This resource contains 5 worksheets for your students to apply what they have learned in the Data strand for Data Literacy. Each worksheet specifies which Ontario Curriculum Expectation is being covered. *These workshee
Subjects:
Grades:
5th - 7th
Types:
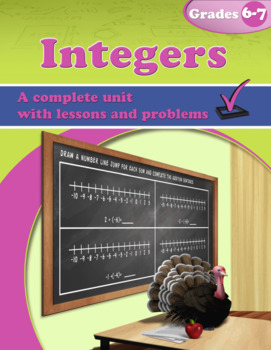
Integers (Distance Learning)
The unit Integers covers all the important integer topics for middle school (grades 6-8), with instructions written directly to the student, so it requires very little teacher involvement.Integers are introduced using the number line to relate them to the concepts of temperature, elevation, and money. We also study briefly the ideas of absolute value (an integer’s distance from zero) and the opposite of a number.Adding and subtracting integers is presented through two main models: (1) movements
Subjects:
Grades:
6th - 7th
Types:
Also included in: 7th Grade Math Units Bundle (Distance Learning)
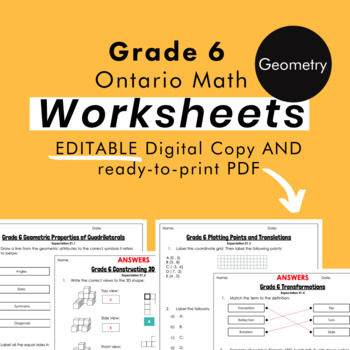
Grade 6 Ontario Math - Geometry Worksheets - PDF+FULLY Editable Google Slides
Are you looking for practical and easy to use supplement practice for the NEW Grade 6 Ontario Math Curriculum? These ready-to-print PDF and EDITABLE worksheets is exactly what you need! Note this resource compliments my digital Geometry unit, but can also be used separately! This resource contains 4 worksheets for your students to apply what they have learned in the Spatial Sense strand for Geometric and Spatial Reasoning. Each worksheet specifies which Ontario Curriculum Expectation is being co
Grades:
5th - 7th
Types:
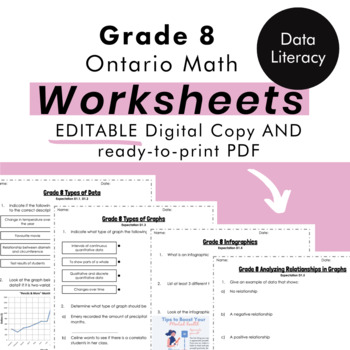
Grade 8 Ontario Math -Data Literacy Worksheets -PDF+FULLY Editable Google Slides
Are you looking for practical and easy to use supplement practice for the NEW Grade 8 Ontario Math Curriculum? These ready-to-print PDF and EDITABLE worksheets is exactly what you need! Note this resource compliments my digital Data Literacy Unit, but can also be used separately! This resource contains 5 worksheets for your students to apply what they have learned in the Data strand for Data Literacy. Each worksheet specifies which Ontario Curriculum Expectation is being covered. *These workshee
Subjects:
Grades:
7th - 9th
Types:
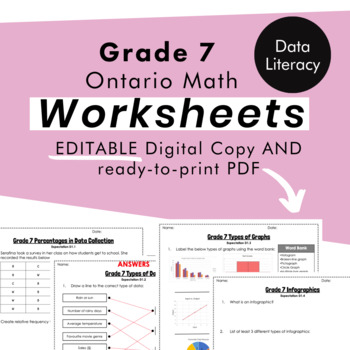
Grade 7 Ontario Math -Data Literacy Worksheets -PDF+FULLY Editable Google Slides
Are you looking for practical and easy to use supplement practice for the NEW Grade 7 Ontario Math Curriculum? These ready-to-print PDF and EDITABLE worksheets is exactly what you need! Note this resource compliments my digital Data Literacy Unit, but can also be used separately! This resource contains 6 worksheets for your students to apply what they have learned in the Data strand for Data Literacy. Each worksheet specifies which Ontario Curriculum Expectation is being covered. *These workshee
Subjects:
Grades:
6th - 8th
Types:
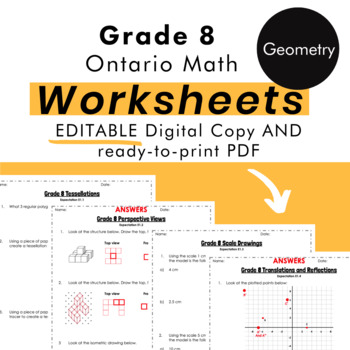
Grade 8 Ontario Math - Geometry Worksheets PDF + Editable Google Slides
Are you looking for practical and easy to use supplement practice for the NEW Grade 8 Ontario Math Curriculum? These ready-to-print PDF and EDITABLE worksheets is exactly what you need! Note this resource compliments my digital Geometry Unit, but can also be used separately! This resource contains 5 worksheets for your students to apply what they have learned in the Spatial Sense strand for Geometric and Spatial Reasoning. Each worksheet specifies which Ontario Curriculum Expectation is being co
Grades:
7th - 9th
Types:
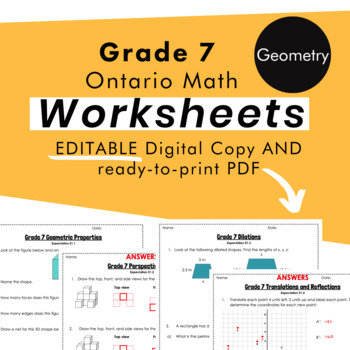
Grade 7 Ontario Math - Geometry Worksheets - PDF+FULLY Editable Google Slides
Are you looking for practical and easy to use supplement practice for the NEW Grade 7 Ontario Math Curriculum? These ready-to-print PDF and EDITABLE worksheets is exactly what you need! Note this resource compliments my digital Geometry Unit, but can also be used separately! This resource contains 5 worksheets for your students to apply what they have learned in the Spatial Sense strand for Geometric and Spatial Reasoning. Each worksheet specifies which Ontario Curriculum Expectation is being co
Grades:
6th - 8th
Types:
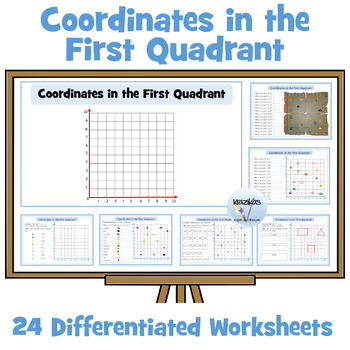
Coordinates in the First Quadrant Worksheets
This resource contains a 24 page workbook / 24 differentiated worksheets on coordinates in the first quadrant. Answers are provided.Tasks include:locating coordinatesplotting coordinatesfinding missing coordinatesYou may also be interested in:Coordinates in the First Quadrant PowerPoint LessonThis is an accompanying highly visual and interactive 50-slide PowerPoint lesson on coordinates in the first quadrant. The PowerPoint clearly explains and visually demonstrates the following:gridsx and y ax
Grades:
4th - 8th
Types:
Also included in: Coordinates in the First Quadrant
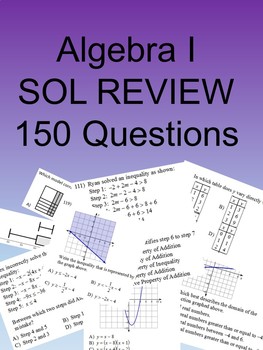
Algebra I 150 Multiple Choice SOL type questions
I have recently updated this product so that it is editable and has an easier to read format. In addition to a pdf you will receive a docx file that has the questions as images. You can delete questions, rearrange, or insert your own questions. 150 mostly multiple choice questions with a few multiple answers and free response as well similar to questions from the Virginia SOLs. Questions cover the entire algebra I curriculum. Use as Final Exam review or SOL Review.There are at least two que
Grades:
7th - 10th
CCSS:
Making Science Charts and Graphs
A simplified look at making charts and organizing data in science.
-Data Charts
-Circle Graphs
-Bar Graphs
-Line Graphs
-Key Vocabulary List
-Quiz/Assessment
-Activity - Practice
-Teacher answer key for quiz and activity
Thanks for taking the time to stop by my store!
Mrs. Degs
Teaching Science Well
Blog: http://teachingsciencewell.wordpress.com/
Facebook: https://www.facebook.com/TeachingScienceWell
TPT: http://www.teacherspayteachers.com/Store/Teaching-Science-Well-Science-Resources
Pi
Subjects:
Grades:
3rd - 10th
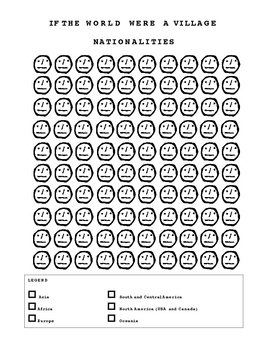
If The World Were a Village Student Workbook Printable
A great package designed to integrate Math, Social Studies, and Language Arts instruction to supplement reading the children's book If the World Were a Village. Each class, we read 1-2 pages from the book If the World Were A Village which narrows the world population down to a village of 100 people and examines nationalities, languages, religions, ages, wealth, food and water, electricity and much more. I soon decided to use the reading to teach students about data management, interpretation and
Grades:
3rd - 8th
Types:
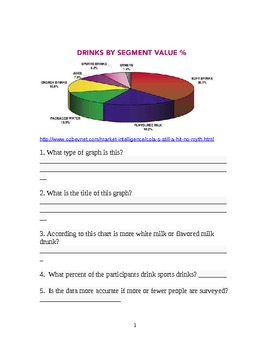
Charts and Graphs for Middle School
Included are thiry-eight graphs, charts, maps, flowcharts, tables and other graphics. These are real data maps taken from the Internet (all sources noted). Under each graphic are five questions that can be answered by using the information provided. The questions range from titles, mean, meadian, to create your own graph.
The pages can be copied back to back to make a workbook. I use this workbook as bellwork while I am taking attendance. Everyday the students answer the question. (I requi
Subjects:
Grades:
6th - 9th
Types:
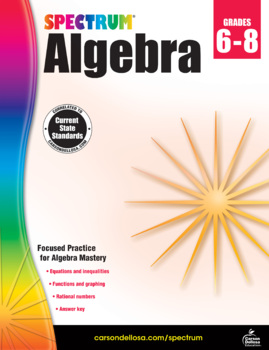
Spectrum Algebra Workbook Grades 6-8 Printable 704706-EB
Help your child ramp up middle-school math skills with the Spectrum® Algebra eBook!• This 128-page downloadable resource provides sequenced instruction, practice, and reinforcement for grades 6 to 8, helping your child to develop problem-solving math skills they can build on.• This standards-based workbook focuses on middle school algebra concepts like equalities, inequalities, factors, fractions, proportions, functions, and more.• Filled with easy instructions and rigorous practice, the Spectru
Subjects:
Grades:
6th - 8th
Types:
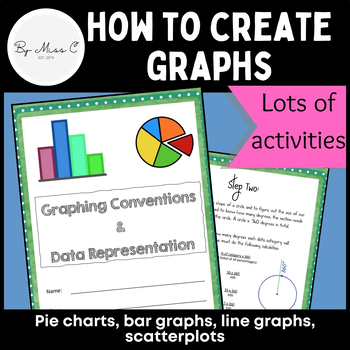
Guide to graphs: Pie charts, bar graphs, line graphs, scatterplots + activities
This is a fantastic resource for introducing students to graphing and data representation. This booklet will take students through the uses for particular graphs and how to construct them. At the end of each module, there are activities for students to complete, to practice their graphing skills. Answer key is included, making this a no-prep activity. This booklet covers: - why we visually represent data- pie charts and how to create them - bar graphs and how to create them - line graphs and how
Subjects:
Grades:
6th - 12th, Higher Education, Adult Education
Types:
CCSS:
TI-Nspire Graphing Calculator for STAAR Algebra 1 EOC (First Edition)
The majority of the STAAR End of Course Algebra 1 assessment items could have been answered using a graphing calculator. These instructions are designed to give students speed, accuracy, and confidence.Topics Covered on the Nspire:(A.1) The student understands that a function represents a dependence of one quantity on another and can be described in a variety of ways. (D) The student represents relationships among quantities using concrete models, tables, graphs, diagrams
Subjects:
Grades:
7th - 12th
Types:
Also included in: STAAR Algebra 1 EOC Bundle
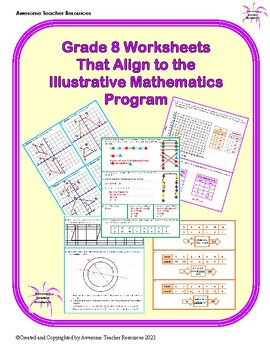
Grade 8 Illustrative Mathematics Aligned Worksheets
This packet includes all of the worksheets aligned with the Illustrative Mathematics Program for Grade 8 created by Awesome Teacher Resources. The packet includes suggestions for extending learning, 22 worksheets and the associated answer keys. Topics covered are transformations, proportional and linear relationships, linear equations and linear systems, functions, dilations and scaled drawings, as well as scatter plots and displaying data. The packet is 245 pages.
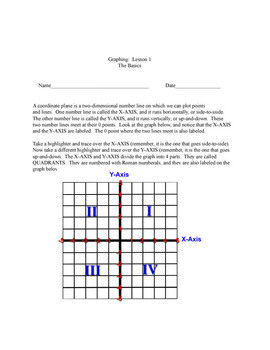
Graphing Booklet #1: The Basics of the Coordinate Plane
I created this booklet for use in my classroom. I have also used it to help students I tutor. I teach geometry, and I noticed that I had a few students who still could not plot points correctly. I made this booklet, which includes step-by-step lessons and activities on the basics of the coordinate plane (the x and y-axis, the origin, the quadrants, ordered pairs, plotting points), and it has helped the students tremendously. When I shared this booklet with other teachers, they requested copi
Grades:
4th - 9th
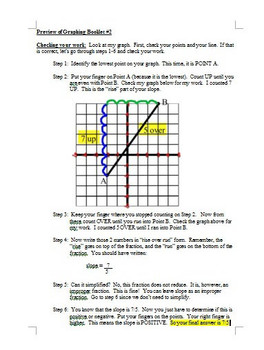
Graphing Booklet #2: Slope Formula and the Rise over Run Method
This is my follow-up to my first graphing booklet. In this booklet, students will first determine whether the slope of a line is positive, negative, zero, or undefined by looking at a graphed line. This lesson is crucial in future success of determing the exact slope of a line. In lesson 2, students will learn the "rise over run" method of determining slope of a graphed line. I teach this differently than many people, and I explain a very simple (tactile) method of determing whether a slope
Grades:
5th - 10th
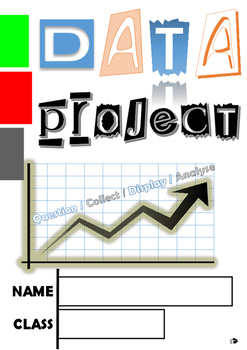
Data Project - Data representation and interpretation
This booklet walks students through the stages of data investigations:
STAGE 1: Deciding on a topic and posing a question
STAGE 2: Collecting raw data
STAGE 3: Graph or Display
STAGE 4: Analyse and Interpret
STAGE 5: Draw conclusion, reflect
The booklet has clear explanations at appropriate stages to support students in the more technical maths such as finding averages.
IF YOU LIKE THIS RESOURCE - PLEASE RATE
Subjects:
Grades:
3rd - 8th
Types:
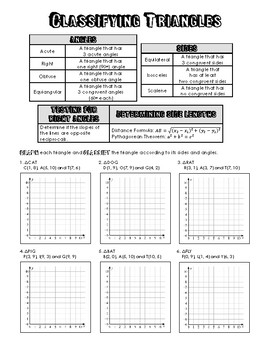
Classifying Triangles in a Coordinate Plane
Classifying Triangles in a Coordinate Plane
Grades:
7th - 12th
Types:

Coordinate Graphing - GraphX - Mascot Bundle #2
Dr. Sigma's World Of Mathematics Mascots #2 is a compilation workbook of mathematics worksheets that can be used by all levels of mathematics (upper elementary through high school). These worksheets involve solving problems and then plotting the answers as points which, once they are connected, form pictures. Included in this workbook are coordinate graphing exercises that make pictures of a devil, a pirate, a mustang and a bandit.Would you like to receive updates and information about new produ
Grades:
4th - 12th
Types:
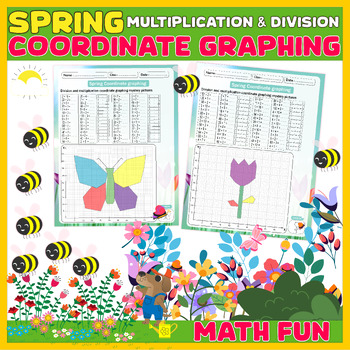
Spring Math Activities | Coordinate Graphing Mystery Pictures Worksheets
Dive into spring with our captivating Spring Math Worksheets! These engaging resources blend the excitement of mystery pictures with essential multiplication and division practice, making learning a thrilling adventure for your students. Each worksheet features a unique mystery picture that students reveal as they correctly solve the math problems, adding an element of surprise and fun to their learning journey. Perfect for reinforcing math skills in a delightful spring-themed context, these wor
Grades:
3rd - 7th
Types:
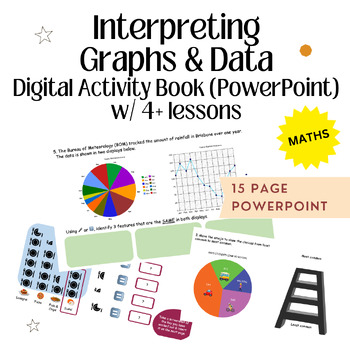
V8.4 Aligned Interpreting Graphs and Data Interactive Activity Book (PowerPoint)
This is a PowerPoint that students can work through independently if they have iPads or laptops, or could be printed, or used as a teacher presentation for explicit teaching.It provides multiple opportunities for independent, pair, group, or whole-class engagement. The resource is interactive, visual, chunked and provides choice in how questions can be answered: either through voice recordings or text. The questions were modelled from the Queensland Government C2C assessment for Interpreting Gra
Subjects:
Grades:
5th - 7th
Showing 1-24 of 90 results


