3 results
Graphing Common Core W.8.1 resources

Analyzing Graphs: Bus Ridership Trends, Story Problems, Middle School
Embark on a fascinating journey through the intricate world of bus ridership trends in America with our comprehensive lesson on graph analysis and story problem creation. Dive into this graph which showcases the dynamic shifts in bus ridership, and empower students to craft compelling story problems that reflect their understanding of the data.In this engaging lesson package, students will analyze interactive graphs illustrating the nuanced landscape of bus ridership trends across different citi
Subjects:
Grades:
6th - 8th

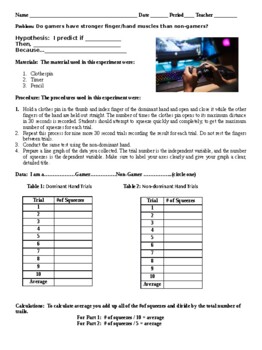
NGSS Lab - Gamer's vs Non-Gamers - "Muscle Fatigue"
The lab is a great introductory lab to the process of science since it develops skills in identifying types of variables, testing student's ability to collect data, graph information, and formulate conclusions based on the problem of the day.Students will apply their learning and understanding using the Science and Engineering Processes to pose a hypothesis, analyzing and interpreting data, create a CER to engage in argument with evidence, and finally design and carry out their own experiment.
Grades:
6th - 12th
Types:
NGSS:
MS-ETS1-1

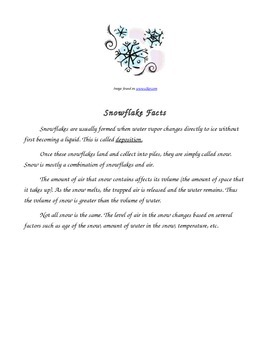
Snow Science! How Dense is Our Snow? A Hands On Science Experiment.
When the snow starts falling, students love to play around in it. Here is a science experiment that ties in their love of snow with learning! This Science Experiment measures the amount of liquid in snow and leads to a discussion on density. I tie this experiment to an introduction to our fractions unit in math. Even in 5th grade students need a reminder that fractions are a part of a whole. They will also get to see a real world example of when fractions, graphs, and line plots are used to help
Subjects:
Grades:
3rd - 8th
Types:
Showing 1-3 of 3 results


